Estimated Value: $1,227,000 - $1,492,000
9
Beds
4
Baths
4,884
Sq Ft
$273/Sq Ft
Est. Value
About This Home
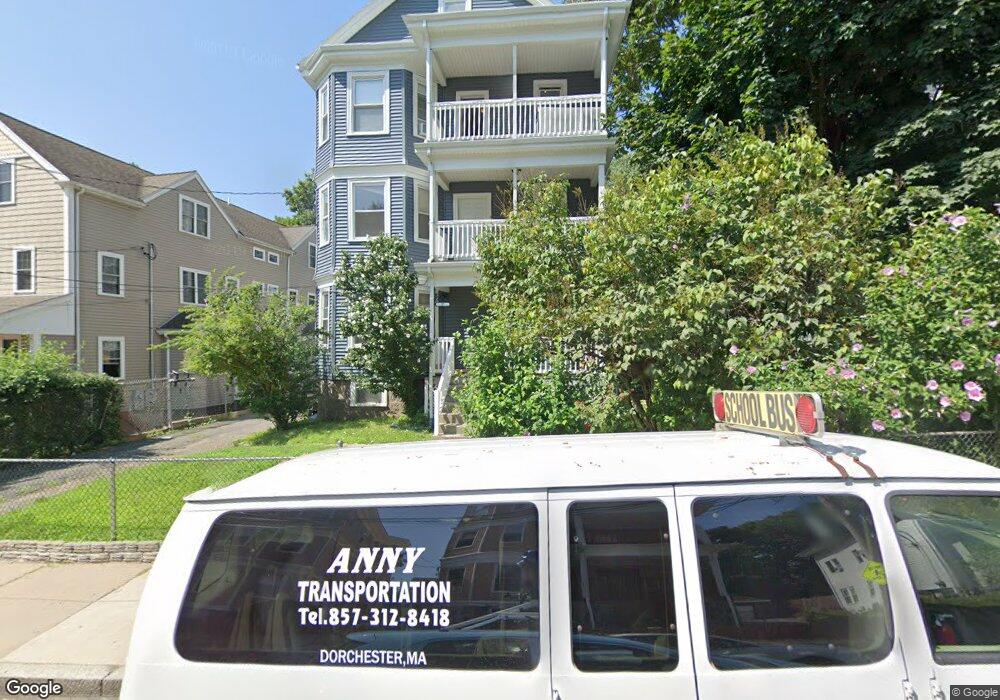
This home is located at 17 Abbot St, Dorchester Center, MA 02124 and is currently estimated at $1,335,333, approximately $273 per square foot. 17 Abbot St is a home located in Suffolk County with nearby schools including UP Academy Charter School of Dorchester and Mother Caroline Academy & Education Center.
Ownership History
Date
Name
Owned For
Owner Type
Purchase Details
Closed on
May 18, 2011
Sold by
Telisnor Susie A
Bought by
Valdez Berjica L
Current Estimated Value
Home Financials for this Owner
Home Financials are based on the most recent Mortgage that was taken out on this home.
Original Mortgage
$367,893
Outstanding Balance
$264,192
Interest Rate
5.62%
Mortgage Type
FHA
Estimated Equity
$1,071,141
Purchase Details
Closed on
Dec 13, 1989
Sold by
Jeremie Adell
Bought by
Telisnor Susie A
Home Financials for this Owner
Home Financials are based on the most recent Mortgage that was taken out on this home.
Original Mortgage
$190,800
Interest Rate
9.73%
Mortgage Type
Purchase Money Mortgage
Create a Home Valuation Report for This Property
The Home Valuation Report is an in-depth analysis detailing your home's value as well as a comparison with similar homes in the area
Home Values in the Area
Average Home Value in this Area
Purchase History
| Date | Buyer | Sale Price | Title Company |
|---|---|---|---|
| Valdez Berjica L | $355,000 | -- | |
| Telisnor Susie A | $212,000 | -- |
Source: Public Records
Mortgage History
| Date | Status | Borrower | Loan Amount |
|---|---|---|---|
| Open | Valdez Berjica L | $367,893 | |
| Previous Owner | Telisnor Susie A | $181,050 | |
| Previous Owner | Telisnor Susie A | $20,000 | |
| Previous Owner | Telisnor Susie A | $190,800 | |
| Previous Owner | Telisnor Susie A | $46,879 |
Source: Public Records
Tax History Compared to Growth
Tax History
| Year | Tax Paid | Tax Assessment Tax Assessment Total Assessment is a certain percentage of the fair market value that is determined by local assessors to be the total taxable value of land and additions on the property. | Land | Improvement |
|---|---|---|---|---|
| 2025 | $13,676 | $1,181,000 | $312,100 | $868,900 |
| 2024 | $12,293 | $1,127,800 | $309,100 | $818,700 |
| 2023 | $11,009 | $1,025,000 | $280,900 | $744,100 |
| 2022 | $10,418 | $957,500 | $262,400 | $695,100 |
| 2021 | $9,460 | $886,600 | $243,000 | $643,600 |
| 2020 | $8,583 | $812,800 | $265,900 | $546,900 |
| 2019 | $7,787 | $738,800 | $180,900 | $557,900 |
| 2018 | $6,733 | $642,500 | $180,900 | $461,600 |
| 2017 | $6,734 | $635,900 | $180,900 | $455,000 |
| 2016 | $4,888 | $444,400 | $180,900 | $263,500 |
| 2015 | $4,751 | $392,300 | $129,000 | $263,300 |
| 2014 | $4,528 | $359,900 | $129,000 | $230,900 |
Source: Public Records
Map
Nearby Homes
- 88 Esmond St
- 104 Nightingale St
- 7-9 Esmond St
- 88 Wales St Unit 3
- 52 Bicknell St
- 41 Charlotte St
- 54 Bicknell St Unit 3
- 54 Bicknell St Unit 2
- 54 Bicknell St Unit 1
- 81 Kingsdale St
- 35 Bradshaw St
- 27 Bradshaw St
- 19 Nightingale St
- 72 Kingsdale St
- 15 Nightingale St
- 52 Mclellan St
- 21 Mclellan St
- 15 Mclellan St
- 74 Glenway St
- 69 Greenwood St
- 19 Abbot St Unit 2
- 19 Abbot St Unit 1
- 15 Abbot St
- 21 Abbot St
- 21 Abbot St Unit 1
- 21 Abbot St Unit 3
- 23 Abbot St
- 23 Abbot St
- 23 Abbot St Unit 3
- 23 Abbot St Unit 2
- 23 Abbot St Unit 1
- 11 Abbot St Unit 8
- 11 Abbot St Unit 3
- 11 Abbot St Unit 2
- 11 Abbot St Unit 9
- 11 Abbot St Unit 11
- 6 Vesta Rd
- 6 Vesta Rd Unit 2
- 6 Vesta Rd Unit 3
- 10 Vesta Rd