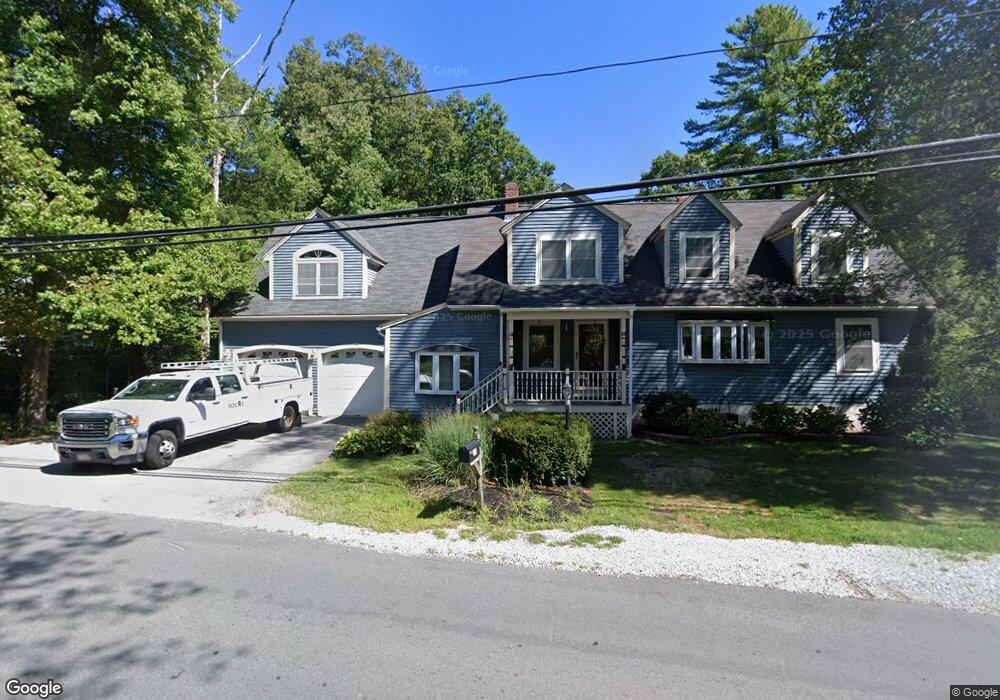
17 Abington St Hingham, MA 02043
South Hingham NeighborhoodEstimated Value: $670,000 - $1,071,000
3
Beds
4
Baths
2,565
Sq Ft
$338/Sq Ft
Est. Value
About This Home
This home is located at 17 Abington St, Hingham, MA 02043 and is currently estimated at $867,946, approximately $338 per square foot. 17 Abington St is a home located in Plymouth County with nearby schools including South Elementary School, Hingham Middle School, and Hingham High School.
Ownership History
Date
Name
Owned For
Owner Type
Purchase Details
Closed on
Apr 10, 2002
Sold by
Pimentel Lisa J
Bought by
Roche James M and Roche Patricia M
Current Estimated Value
Purchase Details
Closed on
Jun 15, 1998
Sold by
Potter David A and Potter Charlene M
Bought by
Pimentel Lisa J
Purchase Details
Closed on
Oct 15, 1993
Sold by
Otoole Gary C and Otoole Lynne B
Bought by
Potter David A and Potter Charlene
Create a Home Valuation Report for This Property
The Home Valuation Report is an in-depth analysis detailing your home's value as well as a comparison with similar homes in the area
Home Values in the Area
Average Home Value in this Area
Purchase History
| Date | Buyer | Sale Price | Title Company |
|---|---|---|---|
| Roche James M | $220,000 | -- | |
| Pimentel Lisa J | $150,000 | -- | |
| Potter David A | $118,000 | -- |
Source: Public Records
Mortgage History
| Date | Status | Borrower | Loan Amount |
|---|---|---|---|
| Open | Potter David A | $413,000 | |
| Closed | Potter David A | $97,000 |
Source: Public Records
Tax History
| Year | Tax Paid | Tax Assessment Tax Assessment Total Assessment is a certain percentage of the fair market value that is determined by local assessors to be the total taxable value of land and additions on the property. | Land | Improvement |
|---|---|---|---|---|
| 2025 | $8,931 | $835,500 | $280,800 | $554,700 |
| 2024 | $8,403 | $774,500 | $280,800 | $493,700 |
| 2023 | $7,081 | $708,100 | $280,800 | $427,300 |
| 2022 | $7,008 | $606,200 | $253,500 | $352,700 |
| 2021 | $6,745 | $571,600 | $253,500 | $318,100 |
| 2020 | $6,591 | $571,600 | $253,500 | $318,100 |
| 2019 | $6,423 | $543,900 | $253,500 | $290,400 |
| 2018 | $6,336 | $538,300 | $253,500 | $284,800 |
| 2017 | $5,739 | $468,500 | $210,000 | $258,500 |
| 2016 | $5,352 | $428,500 | $200,100 | $228,400 |
| 2015 | $4,904 | $391,400 | $190,600 | $200,800 |
Source: Public Records
Map
Nearby Homes
- 17 Pine Haven Cir
- 7 Boxberry Ln Unit 7
- 55 Turner Rd
- 18 Colby St
- 346 Union St
- 1 Von Rhor Dr Unit 1
- 949 Union St
- 303 Pond St
- 19 Elizabeth Ln
- 18 Whiting Ln
- 26 Hobart Ln Unit 26,C
- 100 Whiting St
- 17 Elizabeth Ln Unit 17
- 11 Elizabeth Ln
- 15 Elizabeth Ln Unit 15
- 13 Elizabeth Ln Unit 13
- 9 Elizabeth Ln Unit 9
- 7 Elizabeth Ln Unit 7
- 5 Elizabeth Ln Unit 5
- 3 Elizabeth Ln Unit 3
- 5 Dennis Rd
- 0 Abington St
- 4 Dennis Rd
- 19 Abington St
- 3 Dennis Rd
- 15 Abington St
- 2 Dennis Rd
- 1 Dennis Rd
- 4 Hickey Rd
- 0 Dennis Rd Unit 2 71019998
- 0 Dennis Rd Unit 3 71019999
- 0 Dennis Rd Unit 4 71033517
- 0 Dennis Rd Unit 72969359
- 0 Dennis Rd Unit 72934639
- 0 Dennis Rd Unit 72879492
- 0 Dennis Rd Unit 1 71019996
- 6 Hickey Rd
- 3 Hickey Rd
- 7 Abington St
- 7 Hickey Rd
Your Personal Tour Guide
Ask me questions while you tour the home.