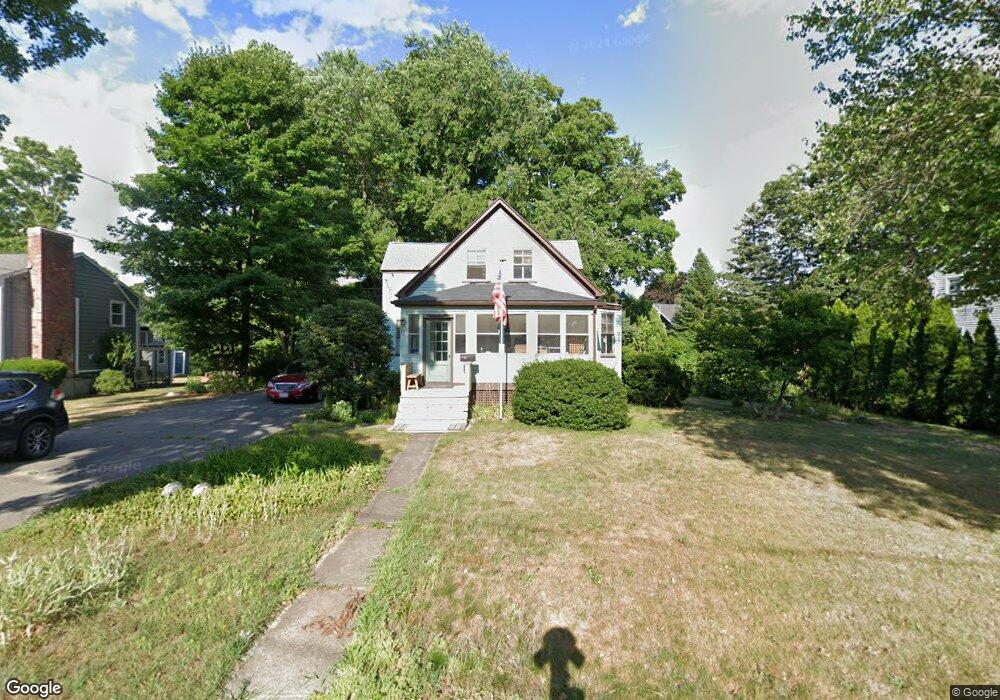
17 Adams St Millis, MA 02054
Estimated Value: $454,000 - $550,000
3
Beds
1
Bath
1,356
Sq Ft
$380/Sq Ft
Est. Value
About This Home
This home is located at 17 Adams St, Millis, MA 02054 and is currently estimated at $514,772, approximately $379 per square foot. 17 Adams St is a home located in Norfolk County with nearby schools including Clyde F Brown, Millis Middle School, and Millis High School.
Ownership History
Date
Name
Owned For
Owner Type
Purchase Details
Closed on
Apr 28, 1998
Sold by
Endgahl John E and Engdahl Deborah A
Bought by
Allison Scott W
Current Estimated Value
Home Financials for this Owner
Home Financials are based on the most recent Mortgage that was taken out on this home.
Original Mortgage
$153,100
Outstanding Balance
$29,941
Interest Rate
7.11%
Mortgage Type
Purchase Money Mortgage
Estimated Equity
$484,831
Purchase Details
Closed on
May 31, 1988
Sold by
Burke Robert A
Bought by
Engdahl John E
Home Financials for this Owner
Home Financials are based on the most recent Mortgage that was taken out on this home.
Original Mortgage
$112,000
Interest Rate
10.18%
Mortgage Type
Purchase Money Mortgage
Create a Home Valuation Report for This Property
The Home Valuation Report is an in-depth analysis detailing your home's value as well as a comparison with similar homes in the area
Home Values in the Area
Average Home Value in this Area
Purchase History
| Date | Buyer | Sale Price | Title Company |
|---|---|---|---|
| Allison Scott W | $161,250 | -- | |
| Engdahl John E | $140,000 | -- |
Source: Public Records
Mortgage History
| Date | Status | Borrower | Loan Amount |
|---|---|---|---|
| Open | Engdahl John E | $153,100 | |
| Previous Owner | Engdahl John E | $106,400 | |
| Previous Owner | Engdahl John E | $112,000 |
Source: Public Records
Tax History
| Year | Tax Paid | Tax Assessment Tax Assessment Total Assessment is a certain percentage of the fair market value that is determined by local assessors to be the total taxable value of land and additions on the property. | Land | Improvement |
|---|---|---|---|---|
| 2025 | $6,780 | $413,400 | $226,200 | $187,200 |
| 2024 | $6,378 | $388,400 | $208,800 | $179,600 |
| 2023 | $5,632 | $322,000 | $166,500 | $155,500 |
| 2022 | $6,500 | $344,300 | $178,600 | $165,700 |
| 2021 | $5,660 | $288,500 | $154,400 | $134,100 |
| 2020 | $5,607 | $278,400 | $144,300 | $134,100 |
| 2019 | $4,944 | $264,400 | $130,300 | $134,100 |
| 2018 | $4,764 | $264,400 | $130,300 | $134,100 |
| 2017 | $4,367 | $237,100 | $109,900 | $127,200 |
| 2016 | $4,135 | $237,100 | $109,900 | $127,200 |
| 2015 | $4,031 | $237,100 | $109,900 | $127,200 |
Source: Public Records
Map
Nearby Homes
Your Personal Tour Guide
Ask me questions while you tour the home.