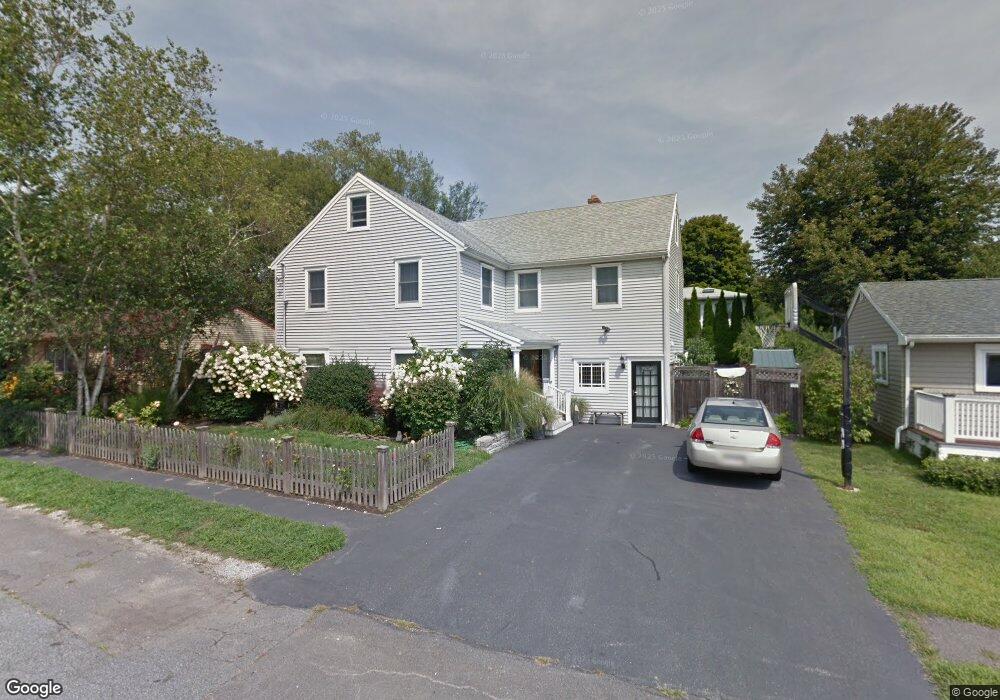
17 Ames Rd Marblehead, MA 01945
Estimated Value: $1,095,000 - $1,268,000
4
Beds
3
Baths
3,244
Sq Ft
$356/Sq Ft
Est. Value
About This Home
This home is located at 17 Ames Rd, Marblehead, MA 01945 and is currently estimated at $1,156,015, approximately $356 per square foot. 17 Ames Rd is a home located in Essex County with nearby schools including Marblehead High School, Devereux School, and Tower School.
Ownership History
Date
Name
Owned For
Owner Type
Purchase Details
Closed on
Jan 8, 2024
Sold by
Borseti Kathleen D and Brackman Caraline D
Bought by
Borseti Brackman Rt and Borseti
Current Estimated Value
Purchase Details
Closed on
Dec 16, 2020
Sold by
Borseti Kathleen D
Bought by
Borseti Kathleen D and Brackman Caraline D
Home Financials for this Owner
Home Financials are based on the most recent Mortgage that was taken out on this home.
Original Mortgage
$510,400
Interest Rate
2.7%
Mortgage Type
New Conventional
Purchase Details
Closed on
Jun 29, 1988
Sold by
Zimman Michael A
Bought by
Borseti Lawrence J
Home Financials for this Owner
Home Financials are based on the most recent Mortgage that was taken out on this home.
Original Mortgage
$164,000
Interest Rate
10.47%
Mortgage Type
Purchase Money Mortgage
Create a Home Valuation Report for This Property
The Home Valuation Report is an in-depth analysis detailing your home's value as well as a comparison with similar homes in the area
Home Values in the Area
Average Home Value in this Area
Purchase History
| Date | Buyer | Sale Price | Title Company |
|---|---|---|---|
| Borseti Brackman Rt | -- | None Available | |
| Borseti Kathleen D | -- | None Available | |
| Borseti Lawrence J | $205,000 | -- |
Source: Public Records
Mortgage History
| Date | Status | Borrower | Loan Amount |
|---|---|---|---|
| Previous Owner | Borseti Kathleen D | $510,400 | |
| Previous Owner | Borseti Lawrence J | $20,000 | |
| Previous Owner | Borseti Lawrence J | $164,000 |
Source: Public Records
Tax History Compared to Growth
Tax History
| Year | Tax Paid | Tax Assessment Tax Assessment Total Assessment is a certain percentage of the fair market value that is determined by local assessors to be the total taxable value of land and additions on the property. | Land | Improvement |
|---|---|---|---|---|
| 2025 | $8,077 | $892,500 | $531,300 | $361,200 |
| 2024 | $7,812 | $871,900 | $543,100 | $328,800 |
| 2023 | $8,024 | $802,400 | $478,100 | $324,300 |
| 2022 | $7,781 | $739,600 | $425,000 | $314,600 |
| 2021 | $7,461 | $716,000 | $401,400 | $314,600 |
| 2020 | $6,929 | $666,900 | $401,400 | $265,500 |
| 2019 | $6,782 | $631,500 | $366,000 | $265,500 |
| 2018 | $6,699 | $607,900 | $342,400 | $265,500 |
| 2017 | $6,563 | $596,100 | $330,600 | $265,500 |
| 2016 | $6,354 | $572,400 | $306,900 | $265,500 |
| 2015 | $5,819 | $525,200 | $259,700 | $265,500 |
| 2014 | $5,491 | $495,100 | $236,100 | $259,000 |
Source: Public Records
Map
Nearby Homes
- 179 Beach Bluff Ave
- 25 Tedesco St
- 212 Humphrey St Unit 205
- 201 Humphrey St Unit 2
- 5 Elmwood Rd
- 48 Bellevue Rd
- 19 Elmwood Rd
- 3 Oak St
- 2 Martin St
- 34 Lafayette St
- 83 Lafayette St
- 25 Manton Rd
- 30 Amherst Rd
- 37 Stanley Rd
- 282 Pleasant St
- 6 Higgins Rd
- 2 Wilfred Terrace
- 9 Tedesco Pond Place Unit 9
- 70 Maverick St
- 24 Orchard Cir