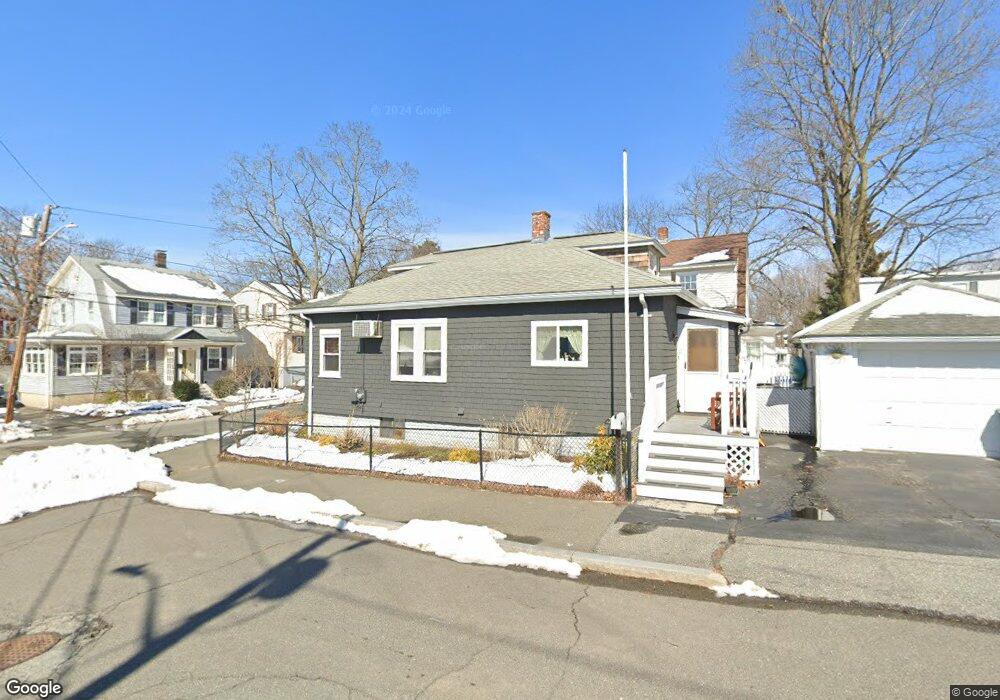
17 Andrews St Medford, MA 02155
North Medford NeighborhoodEstimated Value: $581,000 - $753,000
2
Beds
1
Bath
884
Sq Ft
$717/Sq Ft
Est. Value
About This Home
This home is located at 17 Andrews St, Medford, MA 02155 and is currently estimated at $634,121, approximately $717 per square foot. 17 Andrews St is a home located in Middlesex County with nearby schools including Medford High School, Mystic Valley Regional Charter School, and St. Joseph School.
Ownership History
Date
Name
Owned For
Owner Type
Purchase Details
Closed on
Oct 22, 2007
Sold by
Dillon Dean C
Bought by
Watson Glen E and Watson Lisa M
Current Estimated Value
Home Financials for this Owner
Home Financials are based on the most recent Mortgage that was taken out on this home.
Original Mortgage
$293,395
Interest Rate
6.51%
Mortgage Type
Purchase Money Mortgage
Purchase Details
Closed on
May 24, 2005
Sold by
Vieira Maria N
Bought by
Dillon Dean C
Home Financials for this Owner
Home Financials are based on the most recent Mortgage that was taken out on this home.
Original Mortgage
$140,000
Interest Rate
5.95%
Mortgage Type
Purchase Money Mortgage
Purchase Details
Closed on
Feb 13, 1987
Sold by
Ponce Silvia A
Bought by
Vieira Antonio S
Create a Home Valuation Report for This Property
The Home Valuation Report is an in-depth analysis detailing your home's value as well as a comparison with similar homes in the area
Home Values in the Area
Average Home Value in this Area
Purchase History
| Date | Buyer | Sale Price | Title Company |
|---|---|---|---|
| Watson Glen E | $298,000 | -- | |
| Dillon Dean C | $293,500 | -- | |
| Vieira Antonio S | $129,000 | -- |
Source: Public Records
Mortgage History
| Date | Status | Borrower | Loan Amount |
|---|---|---|---|
| Open | Vieira Antonio S | $297,795 | |
| Closed | Watson Glen E | $293,395 | |
| Previous Owner | Dillon Dean C | $140,000 | |
| Previous Owner | Vieira Antonio S | $99,000 | |
| Previous Owner | Vieira Antonio S | $101,600 | |
| Previous Owner | Vieira Antonio S | $101,600 |
Source: Public Records
Tax History Compared to Growth
Tax History
| Year | Tax Paid | Tax Assessment Tax Assessment Total Assessment is a certain percentage of the fair market value that is determined by local assessors to be the total taxable value of land and additions on the property. | Land | Improvement |
|---|---|---|---|---|
| 2025 | $4,059 | $476,400 | $288,400 | $188,000 |
| 2024 | $4,059 | $476,400 | $288,400 | $188,000 |
| 2023 | $3,942 | $455,700 | $269,500 | $186,200 |
| 2022 | $3,637 | $403,700 | $245,000 | $158,700 |
| 2021 | $3,541 | $376,300 | $233,300 | $143,000 |
| 2020 | $3,375 | $367,700 | $233,300 | $134,400 |
| 2019 | $3,259 | $339,500 | $212,100 | $127,400 |
| 2018 | $3,078 | $300,600 | $192,800 | $107,800 |
| 2017 | $2,879 | $272,600 | $180,200 | $92,400 |
| 2016 | $2,751 | $245,800 | $163,900 | $81,900 |
| 2015 | $2,785 | $238,000 | $156,100 | $81,900 |
Source: Public Records
Map
Nearby Homes