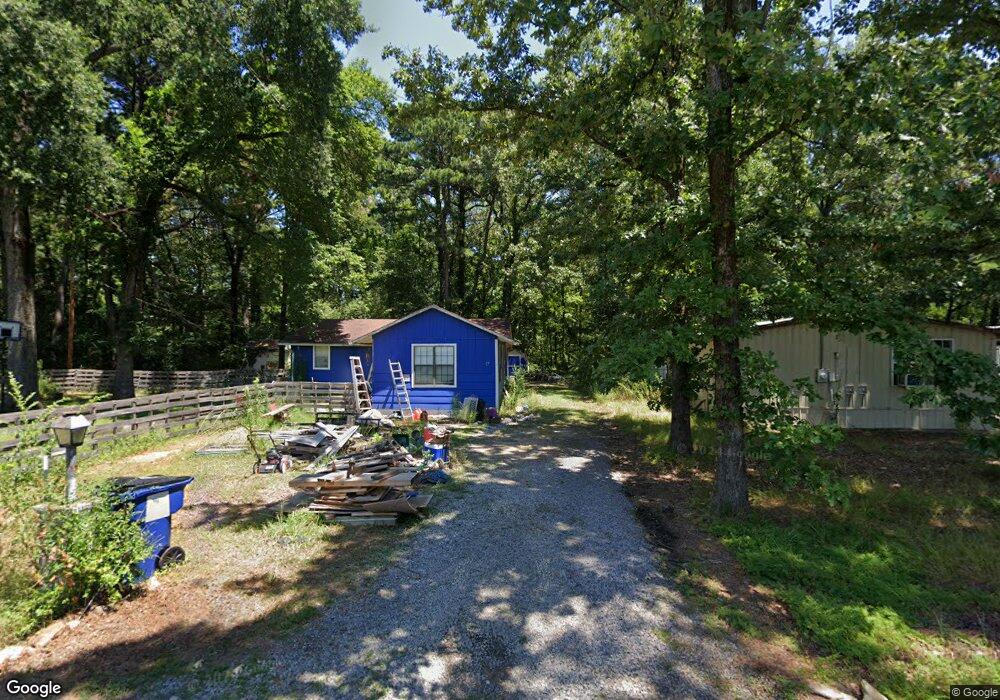
17 Ann Loop Conway, AR 72032
Estimated Value: $113,498 - $217,000
Studio
1
Bath
1,536
Sq Ft
$96/Sq Ft
Est. Value
About This Home
This home is located at 17 Ann Loop, Conway, AR 72032 and is currently estimated at $147,375, approximately $95 per square foot. 17 Ann Loop is a home located in Faulkner County with nearby schools including Preston & Florence Mattison Elementary School, Bob Courtway Middle School, and Conway Junior High School.
Ownership History
Date
Name
Owned For
Owner Type
Purchase Details
Closed on
May 19, 2009
Bought by
Charles Long
Current Estimated Value
Purchase Details
Closed on
Mar 13, 2008
Bought by
Dusty Long
Home Financials for this Owner
Home Financials are based on the most recent Mortgage that was taken out on this home.
Original Mortgage
$62,429
Interest Rate
5.72%
Mortgage Type
New Conventional
Purchase Details
Closed on
Oct 10, 2007
Bought by
Stewart
Purchase Details
Closed on
Oct 5, 2007
Bought by
Stewart
Purchase Details
Closed on
Jun 14, 2007
Bought by
Novastar Mtg
Purchase Details
Closed on
May 22, 2007
Sold by
Tull David and Tull Tracy
Bought by
Novastar Mortgage Inc
Purchase Details
Closed on
May 17, 2004
Bought by
Tull
Purchase Details
Closed on
Dec 10, 1998
Create a Home Valuation Report for This Property
The Home Valuation Report is an in-depth analysis detailing your home's value as well as a comparison with similar homes in the area
Home Values in the Area
Average Home Value in this Area
Purchase History
| Date | Buyer | Sale Price | Title Company |
|---|---|---|---|
| Charles Long | -- | -- | |
| Dusty Long | $60,000 | -- | |
| Long Dusty | $60,000 | Lenders Title Co | |
| Stewart | $28,000 | -- | |
| Stewart | $28,000 | -- | |
| Novastar Mtg | $53,300 | -- | |
| Novastar Mortgage Inc | -- | None Available | |
| Novastar Mtg | $53,300 | -- | |
| Tull | $64,000 | -- | |
| -- | $43,000 | -- | |
| Wanda Sue Sheets Mcguire | -- | -- |
Source: Public Records
Mortgage History
| Date | Status | Borrower | Loan Amount |
|---|---|---|---|
| Previous Owner | Long Dusty | $62,429 |
Source: Public Records
Tax History
| Year | Tax Paid | Tax Assessment Tax Assessment Total Assessment is a certain percentage of the fair market value that is determined by local assessors to be the total taxable value of land and additions on the property. | Land | Improvement |
|---|---|---|---|---|
| 2025 | $770 | $19,800 | $4,800 | $15,000 |
| 2024 | $735 | $19,800 | $4,800 | $15,000 |
| 2023 | $700 | $15,090 | $4,800 | $10,290 |
| 2022 | $370 | $15,090 | $4,800 | $10,290 |
| 2021 | $328 | $15,090 | $4,800 | $10,290 |
| 2020 | $296 | $13,820 | $4,800 | $9,020 |
| 2019 | $287 | $13,820 | $4,800 | $9,020 |
| 2018 | $286 | $13,820 | $4,800 | $9,020 |
| 2017 | $260 | $13,820 | $4,800 | $9,020 |
| 2016 | $233 | $11,920 | $4,800 | $7,120 |
| 2015 | $527 | $11,350 | $2,000 | $9,350 |
| 2014 | $207 | $11,350 | $2,000 | $9,350 |
Source: Public Records
Map
Nearby Homes
- 31 Barham Loop
- 20 Canterberry Point Dr
- 10 Palarm Creek Rd
- 98 Waterfront Cove
- 8 Candlelight Dr
- 303 Rooster Rd
- 12 Oak Leaf Dr
- 41 Oak Leaf Dr
- 13 Oak Leaf Dr
- 28 Candlelight Dr
- 285 Rooster Rd
- Lot 48 Sierra Sunset Cove
- 15 Brown St
- 132 Daugherty Hill Rd
- TBD Priest Ln
- Lot 51 7 Lakes Ranch Blvd
- Lot 10 7 Lakes Ranch Blvd
- Lot 4 7 Lakes Ranch Blvd
- Lot 15 7 Lakes Ranch Blvd
- 20 Morrigan Cove
Your Personal Tour Guide
Ask me questions while you tour the home.