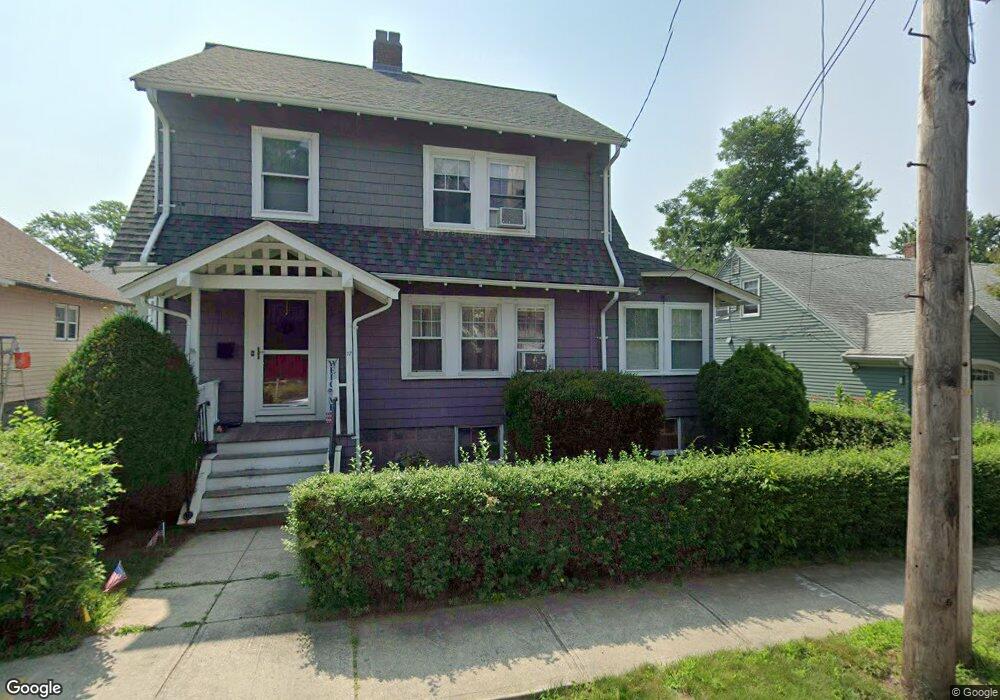
17 Apthorp St Quincy, MA 02170
North Quincy NeighborhoodEstimated Value: $706,000 - $765,000
4
Beds
1
Bath
1,524
Sq Ft
$486/Sq Ft
Est. Value
About This Home
This home is located at 17 Apthorp St, Quincy, MA 02170 and is currently estimated at $740,892, approximately $486 per square foot. 17 Apthorp St is a home located in Norfolk County with nearby schools including Francis W. Parker Elementary School, Atlantic Middle School, and North Quincy High School.
Ownership History
Date
Name
Owned For
Owner Type
Purchase Details
Closed on
Jan 26, 2022
Sold by
Rixham David T and Rixham Tracy L
Bought by
Rixham David T and Rixham Tracy L
Current Estimated Value
Home Financials for this Owner
Home Financials are based on the most recent Mortgage that was taken out on this home.
Original Mortgage
$310,000
Interest Rate
2.6%
Mortgage Type
Stand Alone Refi Refinance Of Original Loan
Purchase Details
Closed on
Sep 30, 2005
Sold by
Lentini Marilyn I
Bought by
Rixham David T and Tomaszewski Linda
Home Financials for this Owner
Home Financials are based on the most recent Mortgage that was taken out on this home.
Original Mortgage
$308,000
Interest Rate
5.84%
Mortgage Type
Purchase Money Mortgage
Create a Home Valuation Report for This Property
The Home Valuation Report is an in-depth analysis detailing your home's value as well as a comparison with similar homes in the area
Home Values in the Area
Average Home Value in this Area
Purchase History
| Date | Buyer | Sale Price | Title Company |
|---|---|---|---|
| Rixham David T | -- | None Available | |
| Rixham David T | -- | None Available | |
| Rixham David T | $385,000 | -- | |
| Rixham David T | $385,000 | -- |
Source: Public Records
Mortgage History
| Date | Status | Borrower | Loan Amount |
|---|---|---|---|
| Previous Owner | Rixham David T | $310,000 | |
| Previous Owner | Rixham David T | $308,000 | |
| Previous Owner | Rixham David T | $38,400 |
Source: Public Records
Tax History Compared to Growth
Tax History
| Year | Tax Paid | Tax Assessment Tax Assessment Total Assessment is a certain percentage of the fair market value that is determined by local assessors to be the total taxable value of land and additions on the property. | Land | Improvement |
|---|---|---|---|---|
| 2025 | $7,578 | $657,200 | $353,900 | $303,300 |
| 2024 | $7,338 | $651,100 | $353,900 | $297,200 |
| 2023 | $6,659 | $598,300 | $321,700 | $276,600 |
| 2022 | $6,475 | $540,500 | $257,400 | $283,100 |
| 2021 | $6,435 | $530,100 | $257,400 | $272,700 |
| 2020 | $6,271 | $504,500 | $252,300 | $252,200 |
| 2019 | $6,063 | $483,100 | $242,600 | $240,500 |
| 2018 | $6,050 | $453,500 | $231,100 | $222,400 |
| 2017 | $5,835 | $411,800 | $210,100 | $201,700 |
| 2016 | $5,450 | $379,500 | $191,000 | $188,500 |
| 2015 | $5,049 | $345,800 | $173,600 | $172,200 |
| 2014 | $4,913 | $330,600 | $173,600 | $157,000 |
Source: Public Records
Map
Nearby Homes
- 6 Warwick St
- 58 Bayfield Rd S
- 101 Beach St
- 297 Billings St
- 85 E Squantum St Unit 10
- 522 Hancock St
- 11 Earle St
- 201 Billings St
- 17 Holmes St Unit 2
- 17 Holmes St Unit 4
- 38 Walker St
- 140 Phillips St
- 25 Hummock Rd
- 143 Arlington St
- 250 Fayette St
- 175 Quincy Shore Dr Unit B24
- 91 Atlantic St
- 115 W Squantum St Unit 907
- 115 W Squantum St Unit 810
- 212 Quincy Shore Dr
- 19 Apthorp St
- 23 Apthorp St
- 21 Apthorp St
- 11 Apthorp St
- 14 Channing St
- 25 Apthorp St
- 8 Channing St Unit 1
- 8 Channing St
- 4 Channing St
- 18 Channing St
- 26 Apthorp St
- 29 Apthorp St
- 242 Billings Rd
- 254 Billings Rd
- 254 Billings Rd Unit 1
- 252 Billings Rd
- 18 Apthorp St Unit F
- 18 Apthorp St Unit E
- 18 Apthorp St Unit D
- 18 Apthorp St Unit C