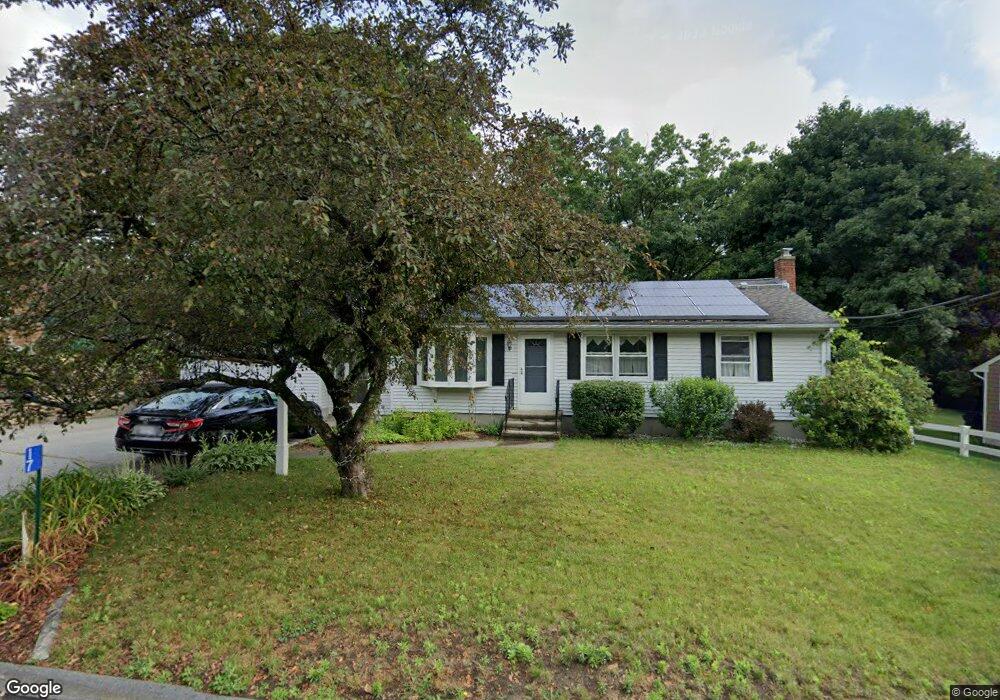
17 Barbara Ave Auburn, MA 01501
Downtown Auburn NeighborhoodEstimated Value: $459,000 - $509,000
3
Beds
3
Baths
1,232
Sq Ft
$392/Sq Ft
Est. Value
About This Home
This home is located at 17 Barbara Ave, Auburn, MA 01501 and is currently estimated at $482,749, approximately $391 per square foot. 17 Barbara Ave is a home located in Worcester County with nearby schools including Auburn Senior High School and Shrewsbury Montessori School - Auburn Campus.
Ownership History
Date
Name
Owned For
Owner Type
Purchase Details
Closed on
Aug 23, 2022
Sold by
Fenby-Lazerick Pamela A
Bought by
Lazerick Rt 2022
Current Estimated Value
Purchase Details
Closed on
Jul 1, 1997
Sold by
Devarney William J and Devarney Lynn M
Bought by
Fenby Pamela A
Home Financials for this Owner
Home Financials are based on the most recent Mortgage that was taken out on this home.
Original Mortgage
$112,200
Interest Rate
7.81%
Mortgage Type
Purchase Money Mortgage
Purchase Details
Closed on
Dec 7, 1989
Sold by
Ciavarra Louis
Bought by
Clover Hill Rlty Corp
Home Financials for this Owner
Home Financials are based on the most recent Mortgage that was taken out on this home.
Original Mortgage
$122,000
Interest Rate
9.72%
Mortgage Type
Purchase Money Mortgage
Create a Home Valuation Report for This Property
The Home Valuation Report is an in-depth analysis detailing your home's value as well as a comparison with similar homes in the area
Home Values in the Area
Average Home Value in this Area
Purchase History
| Date | Buyer | Sale Price | Title Company |
|---|---|---|---|
| Lazerick Rt 2022 | -- | None Available | |
| Fenby Pamela A | $132,000 | -- | |
| Clover Hill Rlty Corp | $155,000 | -- |
Source: Public Records
Mortgage History
| Date | Status | Borrower | Loan Amount |
|---|---|---|---|
| Previous Owner | Clover Hill Rlty Corp | $115,000 | |
| Previous Owner | Clover Hill Rlty Corp | $112,200 | |
| Previous Owner | Clover Hill Rlty Corp | $138,000 | |
| Previous Owner | Clover Hill Rlty Corp | $122,000 |
Source: Public Records
Tax History Compared to Growth
Tax History
| Year | Tax Paid | Tax Assessment Tax Assessment Total Assessment is a certain percentage of the fair market value that is determined by local assessors to be the total taxable value of land and additions on the property. | Land | Improvement |
|---|---|---|---|---|
| 2025 | $58 | $404,600 | $139,000 | $265,600 |
| 2024 | $6,008 | $402,400 | $133,100 | $269,300 |
| 2023 | $5,793 | $364,800 | $121,000 | $243,800 |
| 2022 | $5,433 | $323,000 | $121,000 | $202,000 |
| 2021 | $5,291 | $291,700 | $106,800 | $184,900 |
| 2020 | $5,245 | $291,700 | $106,800 | $184,900 |
| 2019 | $4,916 | $266,900 | $105,800 | $161,100 |
| 2018 | $4,678 | $253,700 | $98,900 | $154,800 |
| 2017 | $4,484 | $244,500 | $89,700 | $154,800 |
| 2016 | $4,282 | $236,700 | $93,400 | $143,300 |
| 2015 | $3,972 | $230,100 | $93,400 | $136,700 |
| 2014 | $3,755 | $217,200 | $88,800 | $128,400 |
Source: Public Records
Map
Nearby Homes