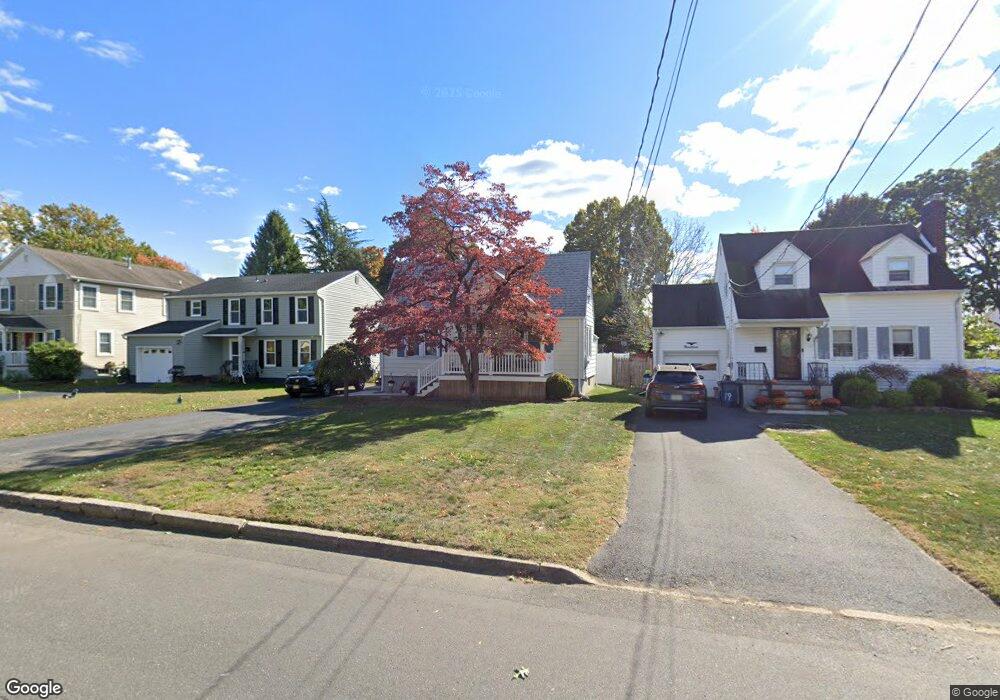
17 Barkalow Ave Freehold, NJ 07728
Estimated Value: $467,173 - $518,000
3
Beds
1
Bath
1,264
Sq Ft
$399/Sq Ft
Est. Value
About This Home
This home is located at 17 Barkalow Ave, Freehold, NJ 07728 and is currently estimated at $503,793, approximately $398 per square foot. 17 Barkalow Ave is a home located in Monmouth County with nearby schools including Park Avenue Elementary School, Freehold Intermediate School, and Freehold Borough High School.
Ownership History
Date
Name
Owned For
Owner Type
Purchase Details
Closed on
Sep 1, 2006
Sold by
Edwards Thomas
Bought by
Philben Michael J and Philben Hayriye
Current Estimated Value
Home Financials for this Owner
Home Financials are based on the most recent Mortgage that was taken out on this home.
Original Mortgage
$241,000
Outstanding Balance
$145,674
Interest Rate
6.79%
Mortgage Type
New Conventional
Estimated Equity
$358,119
Purchase Details
Closed on
Jul 11, 2000
Sold by
Snyder Elaine
Bought by
Sullivan Steen
Home Financials for this Owner
Home Financials are based on the most recent Mortgage that was taken out on this home.
Original Mortgage
$107,900
Interest Rate
8.28%
Create a Home Valuation Report for This Property
The Home Valuation Report is an in-depth analysis detailing your home's value as well as a comparison with similar homes in the area
Home Values in the Area
Average Home Value in this Area
Purchase History
| Date | Buyer | Sale Price | Title Company |
|---|---|---|---|
| Philben Michael J | $305,000 | -- | |
| Sullivan Steen | $119,990 | -- |
Source: Public Records
Mortgage History
| Date | Status | Borrower | Loan Amount |
|---|---|---|---|
| Open | Philben Michael J | $241,000 | |
| Previous Owner | Sullivan Steen | $107,900 |
Source: Public Records
Tax History Compared to Growth
Tax History
| Year | Tax Paid | Tax Assessment Tax Assessment Total Assessment is a certain percentage of the fair market value that is determined by local assessors to be the total taxable value of land and additions on the property. | Land | Improvement |
|---|---|---|---|---|
| 2025 | $8,211 | $458,600 | $310,800 | $147,800 |
| 2024 | $7,518 | $409,100 | $264,000 | $145,100 |
| 2023 | $7,518 | $358,500 | $216,800 | $141,700 |
| 2022 | $7,011 | $309,100 | $180,000 | $129,100 |
| 2021 | $7,011 | $267,300 | $150,000 | $117,300 |
| 2020 | $6,972 | $261,900 | $150,000 | $111,900 |
| 2019 | $6,850 | $258,500 | $150,000 | $108,500 |
| 2018 | $6,928 | $256,500 | $150,000 | $106,500 |
| 2017 | $6,918 | $255,100 | $150,000 | $105,100 |
| 2016 | $7,333 | $276,200 | $182,500 | $93,700 |
| 2015 | $6,936 | $273,700 | $180,000 | $93,700 |
| 2014 | $6,621 | $273,700 | $180,000 | $93,700 |
Source: Public Records
Map
Nearby Homes