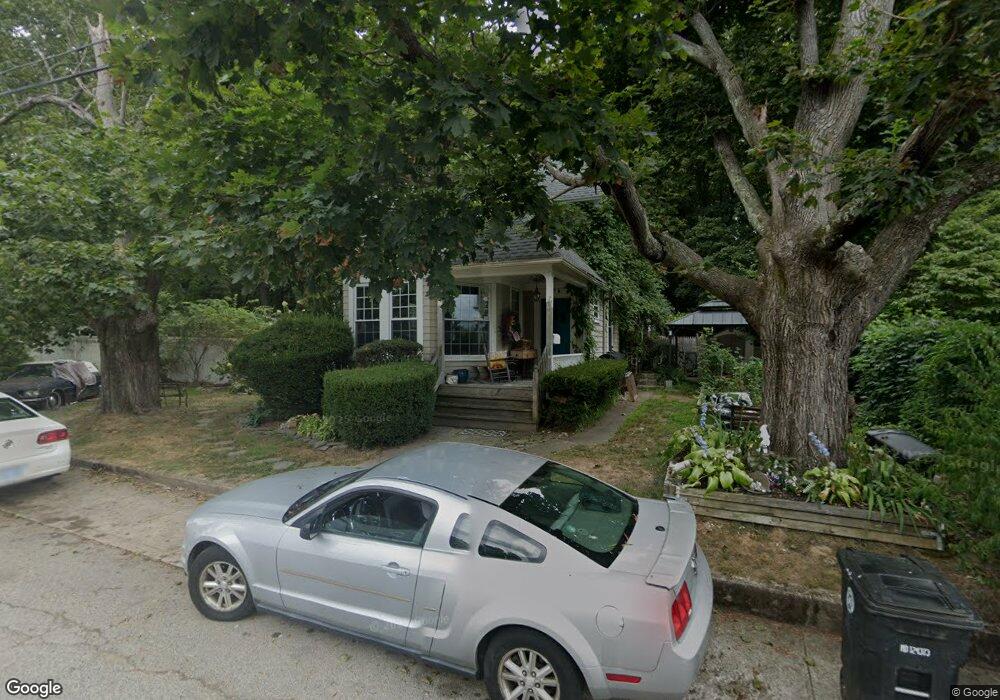
17 Bates Ave Coventry, RI 02816
West Warwick Centre NeighborhoodEstimated Value: $407,971 - $479,000
3
Beds
2
Baths
1,623
Sq Ft
$274/Sq Ft
Est. Value
About This Home
This home is located at 17 Bates Ave, Coventry, RI 02816 and is currently estimated at $445,243, approximately $274 per square foot. 17 Bates Ave is a home located in Kent County with nearby schools including Alan Shawn Feinstein Ms Of Cov and Coventry High School.
Ownership History
Date
Name
Owned For
Owner Type
Purchase Details
Closed on
Aug 20, 2001
Sold by
Canhan John J and Canhan Celeste M
Bought by
Simmons Deanna L
Current Estimated Value
Home Financials for this Owner
Home Financials are based on the most recent Mortgage that was taken out on this home.
Original Mortgage
$140,000
Interest Rate
7.16%
Purchase Details
Closed on
Oct 20, 1988
Sold by
Roche Thomas R
Bought by
Canham John J
Create a Home Valuation Report for This Property
The Home Valuation Report is an in-depth analysis detailing your home's value as well as a comparison with similar homes in the area
Home Values in the Area
Average Home Value in this Area
Purchase History
| Date | Buyer | Sale Price | Title Company |
|---|---|---|---|
| Simmons Deanna L | $160,000 | -- | |
| Canham John J | $112,000 | -- |
Source: Public Records
Mortgage History
| Date | Status | Borrower | Loan Amount |
|---|---|---|---|
| Closed | Canham John J | $115,000 | |
| Closed | Canham John J | $52,000 | |
| Closed | Canham John J | $140,000 | |
| Previous Owner | Canham John J | $111,550 |
Source: Public Records
Tax History
| Year | Tax Paid | Tax Assessment Tax Assessment Total Assessment is a certain percentage of the fair market value that is determined by local assessors to be the total taxable value of land and additions on the property. | Land | Improvement |
|---|---|---|---|---|
| 2025 | $4,743 | $294,800 | $98,200 | $196,600 |
| 2024 | $4,668 | $294,700 | $98,200 | $196,500 |
| 2023 | $4,518 | $294,700 | $98,200 | $196,500 |
| 2022 | $4,018 | $205,300 | $93,900 | $111,400 |
| 2021 | $3,983 | $205,300 | $93,900 | $111,400 |
| 2020 | $4,566 | $205,300 | $93,900 | $111,400 |
| 2019 | $3,948 | $177,500 | $79,000 | $98,500 |
| 2018 | $3,838 | $177,600 | $79,000 | $98,600 |
| 2017 | $3,726 | $177,600 | $79,000 | $98,600 |
| 2016 | $3,539 | $165,300 | $68,500 | $96,800 |
| 2015 | $3,443 | $165,300 | $68,500 | $96,800 |
| 2014 | $3,371 | $165,300 | $68,500 | $96,800 |
| 2013 | $3,753 | $201,100 | $92,400 | $108,700 |
Source: Public Records
Map
Nearby Homes
- 58 Read Ave
- 87 Bates Ave
- 123 Doolittle St
- 2 Ritchotte Ct
- 37 West St
- 22 Wood St
- 37 Phillip St
- 11 Wood St
- 91 Windsor Park Dr
- 176 Archambault Ave
- 0 Beaulieu Ave
- 54 Arthur St
- 16 Morris St
- 131 Pawtuxet Terrace
- 27 Matteson St
- 31 Anthony St Unit 33
- 185 Pulaski St
- 32 Pilgrim Ave
- 152 Brookside Ave
- 777 Main St
- 20 Bates Ave
- 11 Bates Ave
- 25 Bates Ave
- 18 Bates Ave
- 10 Bates Ave
- 29 Bates Ave
- 33 Bates Ave
- 8 Bates Ave
- 433 Washington St
- 39 Bates Ave
- 67 Bates Ave
- 441 Washington St
- 40 Bates Ave
- 436 Washington St Unit 438
- 428 Washington St
- 442 Washington St
- 24 Read Ave
- 20 Read Ave
- 448 Washington St
- 426 Washington St
Your Personal Tour Guide
Ask me questions while you tour the home.