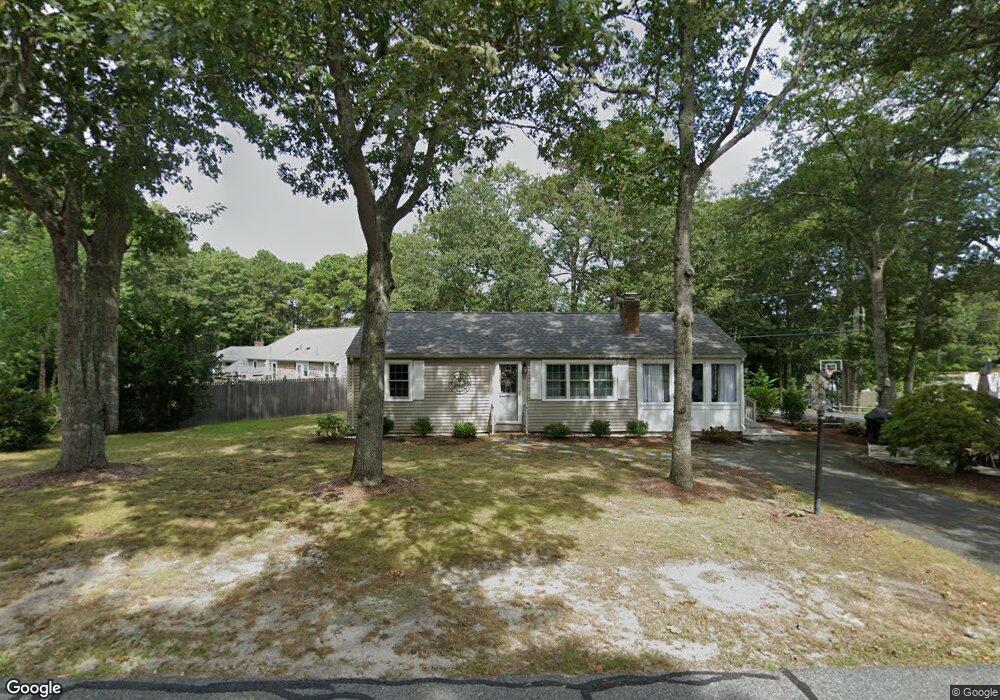
17 Bayridge Dr South Dennis, MA 02660
South Dennis NeighborhoodEstimated Value: $461,000 - $507,081
3
Beds
1
Bath
840
Sq Ft
$579/Sq Ft
Est. Value
About This Home
This home is located at 17 Bayridge Dr, South Dennis, MA 02660 and is currently estimated at $486,020, approximately $578 per square foot. 17 Bayridge Dr is a home located in Barnstable County with nearby schools including Dennis-Yarmouth Regional High School and St. Pius X. School.
Ownership History
Date
Name
Owned For
Owner Type
Purchase Details
Closed on
Oct 1, 2010
Sold by
Maher Patricia R
Bought by
Maher Kevin J and Maher Patricia R
Current Estimated Value
Home Financials for this Owner
Home Financials are based on the most recent Mortgage that was taken out on this home.
Original Mortgage
$178,400
Outstanding Balance
$112,533
Interest Rate
3.5%
Mortgage Type
Adjustable Rate Mortgage/ARM
Estimated Equity
$373,487
Purchase Details
Closed on
Apr 17, 2009
Sold by
Maher Kevin J and Maher Patricia R
Bought by
Maher Patricia R
Purchase Details
Closed on
Sep 24, 2008
Sold by
Maher Patricia R
Bought by
Maher Kevin J and Maher Patricia R
Home Financials for this Owner
Home Financials are based on the most recent Mortgage that was taken out on this home.
Original Mortgage
$180,000
Interest Rate
6.57%
Mortgage Type
Purchase Money Mortgage
Create a Home Valuation Report for This Property
The Home Valuation Report is an in-depth analysis detailing your home's value as well as a comparison with similar homes in the area
Home Values in the Area
Average Home Value in this Area
Purchase History
| Date | Buyer | Sale Price | Title Company |
|---|---|---|---|
| Maher Kevin J | -- | -- | |
| Maher Patricia R | -- | -- | |
| Maher Kevin J | -- | -- |
Source: Public Records
Mortgage History
| Date | Status | Borrower | Loan Amount |
|---|---|---|---|
| Open | Maher Kevin J | $178,400 | |
| Previous Owner | Maher Kevin J | $180,000 |
Source: Public Records
Tax History Compared to Growth
Tax History
| Year | Tax Paid | Tax Assessment Tax Assessment Total Assessment is a certain percentage of the fair market value that is determined by local assessors to be the total taxable value of land and additions on the property. | Land | Improvement |
|---|---|---|---|---|
| 2025 | $1,776 | $410,200 | $132,200 | $278,000 |
| 2024 | $1,634 | $372,100 | $127,200 | $244,900 |
| 2023 | $1,580 | $338,300 | $115,600 | $222,700 |
| 2022 | $1,561 | $278,700 | $115,700 | $163,000 |
| 2021 | $1,483 | $245,900 | $113,400 | $132,500 |
| 2020 | $1,424 | $233,400 | $113,400 | $120,000 |
| 2019 | $1,410 | $228,600 | $122,300 | $106,300 |
| 2018 | $1,274 | $201,000 | $105,900 | $95,100 |
| 2017 | $1,217 | $197,900 | $105,900 | $92,000 |
| 2016 | $1,146 | $175,500 | $111,200 | $64,300 |
| 2015 | $1,123 | $175,500 | $111,200 | $64,300 |
| 2014 | $1,067 | $168,100 | $95,300 | $72,800 |
Source: Public Records
Map
Nearby Homes
- 153 Bayridge Dr
- 4 Ebb Rd
- 11 Uncle Stanleys Way
- 15 Captain Jud Rd
- 17 Margate Ln
- 13 Covey Dr
- 118 Driftwood Ln
- 111 Merchant Ave
- 129 Driftwood Ln
- 17 Fairmount Rd
- 17 Fairmount Rd
- 10 Joanne Dr
- 7 Vinland Dr
- 25 Skerry Rd
- 6 Nimble Hill Dr
- 1 Norseman Dr
- 4 Old Colony Way
- 59 Main St Unit 19-2
- 59 Route 6a Unit 29-4
- 32 Captain Walsh Dr