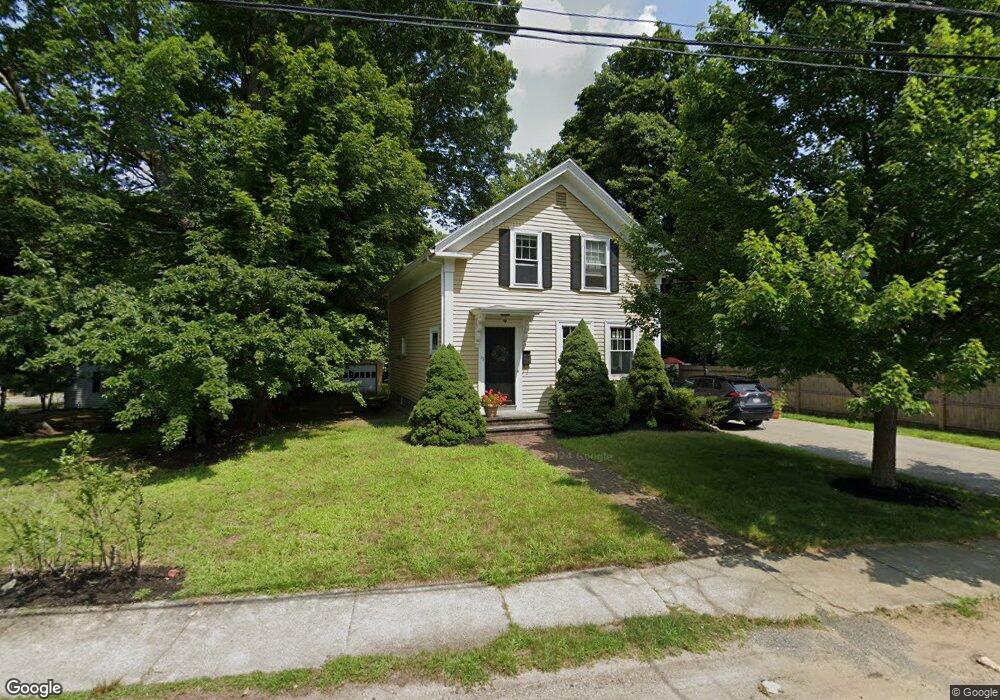
17 Berkeley St Reading, MA 01867
Estimated Value: $841,516 - $957,000
4
Beds
1
Bath
1,574
Sq Ft
$565/Sq Ft
Est. Value
About This Home
This home is located at 17 Berkeley St, Reading, MA 01867 and is currently estimated at $888,629, approximately $564 per square foot. 17 Berkeley St is a home located in Middlesex County with nearby schools including Alice M. Barrows Elementary School, Walter S. Parker Middle School, and Reading Memorial High School.
Ownership History
Date
Name
Owned For
Owner Type
Purchase Details
Closed on
Jun 15, 2004
Sold by
Moynihan Arlene and Moynihan James E
Bought by
Henneberry Elizabeth F and Henneberry Thomas J
Current Estimated Value
Home Financials for this Owner
Home Financials are based on the most recent Mortgage that was taken out on this home.
Original Mortgage
$333,700
Interest Rate
5.99%
Mortgage Type
Purchase Money Mortgage
Purchase Details
Closed on
Jun 7, 2000
Sold by
Mello Robert R and Mello Beth M
Bought by
Moynihan James F and Moynihan Arlene
Home Financials for this Owner
Home Financials are based on the most recent Mortgage that was taken out on this home.
Original Mortgage
$263,900
Interest Rate
8.12%
Mortgage Type
Purchase Money Mortgage
Purchase Details
Closed on
Apr 17, 1991
Sold by
Crispo Philip R and Crispo Geraldine T
Bought by
Mello Robert R and Mello Beth M
Create a Home Valuation Report for This Property
The Home Valuation Report is an in-depth analysis detailing your home's value as well as a comparison with similar homes in the area
Home Values in the Area
Average Home Value in this Area
Purchase History
| Date | Buyer | Sale Price | Title Company |
|---|---|---|---|
| Henneberry Elizabeth F | $450,000 | -- | |
| Moynihan James F | $329,900 | -- | |
| Mello Robert R | $170,000 | -- |
Source: Public Records
Mortgage History
| Date | Status | Borrower | Loan Amount |
|---|---|---|---|
| Open | Mello Robert R | $287,000 | |
| Closed | Mello Robert R | $290,000 | |
| Closed | Henneberry Elizabeth F | $333,700 | |
| Previous Owner | Mello Robert R | $263,900 | |
| Previous Owner | Mello Robert R | $156,900 |
Source: Public Records
Tax History
| Year | Tax Paid | Tax Assessment Tax Assessment Total Assessment is a certain percentage of the fair market value that is determined by local assessors to be the total taxable value of land and additions on the property. | Land | Improvement |
|---|---|---|---|---|
| 2025 | $9,546 | $838,100 | $582,100 | $256,000 |
| 2024 | $9,262 | $790,300 | $548,900 | $241,400 |
| 2023 | $9,212 | $731,700 | $508,200 | $223,500 |
| 2022 | $8,867 | $665,200 | $462,000 | $203,200 |
| 2021 | $7,262 | $600,000 | $424,000 | $176,000 |
| 2020 | $7,042 | $588,400 | $415,800 | $172,600 |
| 2019 | $4,601 | $559,700 | $395,500 | $164,200 |
| 2018 | $5,382 | $528,100 | $373,200 | $154,900 |
| 2017 | $7,555 | $538,500 | $355,400 | $183,100 |
| 2016 | $6,740 | $464,800 | $302,500 | $162,300 |
| 2015 | $6,314 | $429,500 | $279,500 | $150,000 |
| 2014 | $6,117 | $415,000 | $270,100 | $144,900 |
Source: Public Records
Map
Nearby Homes
- 37 Fremont St
- 101 King St Unit 101
- 319 West St
- 45 Longview Rd
- 51 Winslow Rd
- 100 Prescott St
- 16 Munroe Ave
- 103 Oak St
- 5 Washington St Unit D4
- 26 Lothrop Rd
- 430 West St
- 18 Talbot Ln Unit 18
- 20 White Oaks Ln
- 29 Louanis Dr
- 17 Courtyard Place Unit 17
- 106 Johnson Woods Dr Unit 106
- 30 Taylor Dr Unit 3011
- 89 Grand St
- 141 Johnson Woods Dr
- 75 Whitehall Ln
Your Personal Tour Guide
Ask me questions while you tour the home.