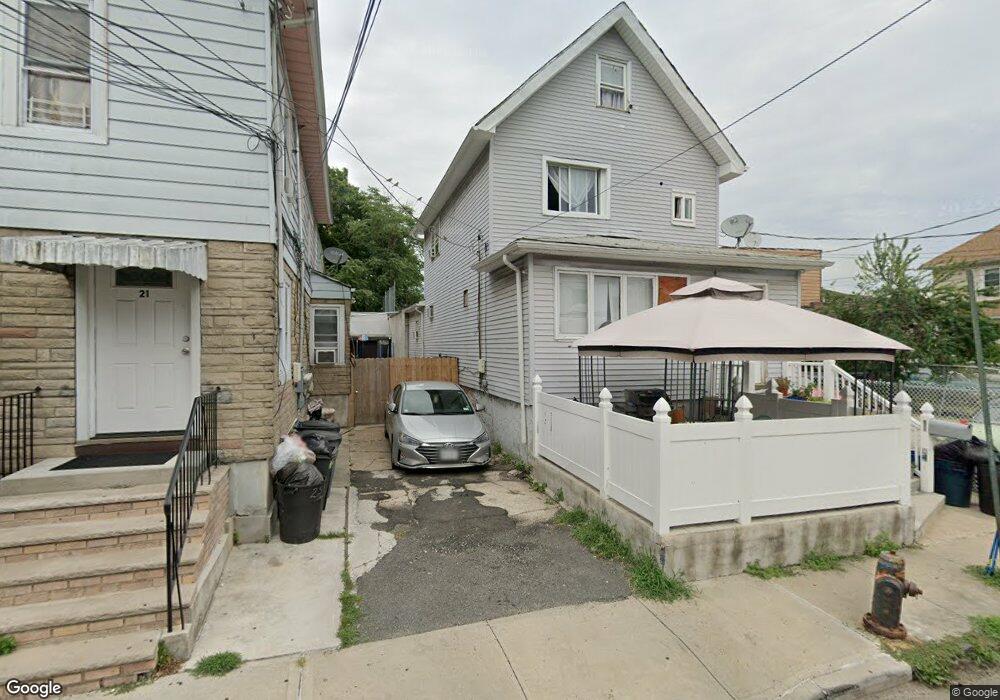
17 Bond St Staten Island, NY 10302
Port Richmond NeighborhoodEstimated Value: $414,000 - $622,000
5
Beds
2
Baths
1,720
Sq Ft
$308/Sq Ft
Est. Value
About This Home
This home is located at 17 Bond St, Staten Island, NY 10302 and is currently estimated at $529,657, approximately $307 per square foot. 17 Bond St is a home located in Richmond County with nearby schools including P.S. 20 Port Richmond, I.S. 51 Edwin Markham, and Susan E Wagner High School.
Ownership History
Date
Name
Owned For
Owner Type
Purchase Details
Closed on
Jun 2, 2009
Sold by
Liquidation Properties Inc
Bought by
Ha Annie and Wong Tat Y
Current Estimated Value
Purchase Details
Closed on
Feb 18, 2005
Sold by
Callender Dominic
Bought by
Callender Dominic and Callender Lucille
Home Financials for this Owner
Home Financials are based on the most recent Mortgage that was taken out on this home.
Original Mortgage
$248,000
Interest Rate
7.95%
Mortgage Type
New Conventional
Purchase Details
Closed on
Aug 24, 1999
Sold by
Schreiner Miriam E and Sepulveda Anthony
Bought by
Callender Dominic
Home Financials for this Owner
Home Financials are based on the most recent Mortgage that was taken out on this home.
Original Mortgage
$103,190
Interest Rate
7.86%
Mortgage Type
FHA
Purchase Details
Closed on
Oct 3, 1995
Sold by
Schreiner Miriam E
Bought by
Schreiner Miriam E and Sepulveda Anthony
Create a Home Valuation Report for This Property
The Home Valuation Report is an in-depth analysis detailing your home's value as well as a comparison with similar homes in the area
Home Values in the Area
Average Home Value in this Area
Purchase History
| Date | Buyer | Sale Price | Title Company |
|---|---|---|---|
| Ha Annie | $105,900 | None Available | |
| Callender Dominic | -- | Fidelity National Title Insu | |
| Callender Dominic | $106,500 | Title Insurance Of Ny Inc | |
| Schreiner Miriam E | -- | -- | |
| Schreiner Miriam E | -- | -- |
Source: Public Records
Mortgage History
| Date | Status | Borrower | Loan Amount |
|---|---|---|---|
| Previous Owner | Callender Dominic | $248,000 | |
| Previous Owner | Callender Dominic | $103,190 |
Source: Public Records
Tax History Compared to Growth
Tax History
| Year | Tax Paid | Tax Assessment Tax Assessment Total Assessment is a certain percentage of the fair market value that is determined by local assessors to be the total taxable value of land and additions on the property. | Land | Improvement |
|---|---|---|---|---|
| 2025 | $3,938 | $33,540 | $2,857 | $30,683 |
| 2024 | $3,938 | $28,740 | $3,234 | $25,506 |
| 2023 | $3,757 | $18,499 | $3,123 | $15,376 |
| 2022 | $2,962 | $24,780 | $4,740 | $20,040 |
| 2021 | $3,576 | $20,520 | $4,740 | $15,780 |
| 2020 | $3,885 | $21,000 | $4,740 | $16,260 |
| 2019 | $3,431 | $20,760 | $4,740 | $16,020 |
| 2018 | $3,143 | $15,416 | $3,993 | $11,423 |
| 2017 | $2,965 | $14,544 | $4,148 | $10,396 |
| 2016 | $2,831 | $14,160 | $4,740 | $9,420 |
| 2015 | $2,613 | $14,040 | $3,960 | $10,080 |
| 2014 | $2,613 | $13,617 | $3,907 | $9,710 |
Source: Public Records
Map
Nearby Homes
- 88 Jewett Ave
- 1418 Castleton Ave
- 1422 Castleton Ave
- 4 Vreeland St
- 18 Cottage Place
- 35 Bennett St
- 173 Clove Rd
- 859 Post Ave
- 1836 Richmond Terrace
- 143 Bodine St
- 90 Vreeland St
- 938 Post Ave
- 83 Palmer Ave
- 90 Ann St
- 30 Decker Ave
- 722 Post Ave
- 286 Jewett Ave
- 25 Lexington Ave
- 1594 Castleton Ave
- 62 Lyceum Ct