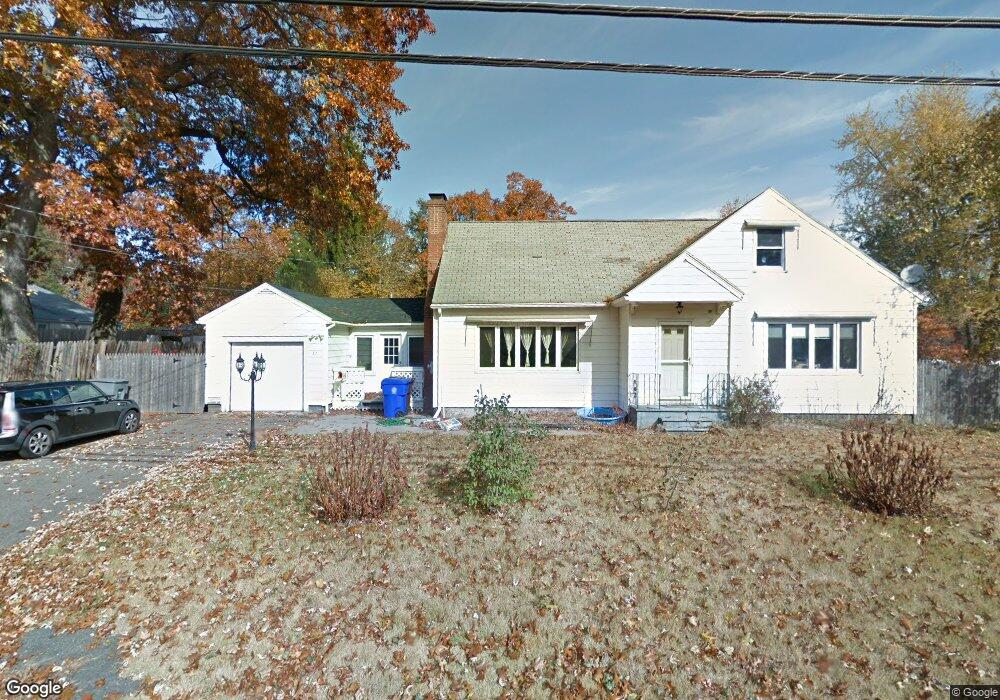
17 Booth Rd Enfield, CT 06082
Estimated Value: $313,000 - $378,186
5
Beds
2
Baths
2,230
Sq Ft
$157/Sq Ft
Est. Value
About This Home
This home is located at 17 Booth Rd, Enfield, CT 06082 and is currently estimated at $351,047, approximately $157 per square foot. 17 Booth Rd is a home located in Hartford County with nearby schools including Prudence Crandall Elementary School, Henry Barnard Elementary School, and Enfield High School.
Ownership History
Date
Name
Owned For
Owner Type
Purchase Details
Closed on
Oct 16, 2013
Sold by
Ling Elisabeth
Bought by
Moncuse Jennifer and Moncuse Robert
Current Estimated Value
Purchase Details
Closed on
Mar 31, 2004
Sold by
Lambert Henry and Lambert Susan
Bought by
Moncuse Robert and Moncuse Jennifer
Home Financials for this Owner
Home Financials are based on the most recent Mortgage that was taken out on this home.
Original Mortgage
$194,000
Interest Rate
5.56%
Create a Home Valuation Report for This Property
The Home Valuation Report is an in-depth analysis detailing your home's value as well as a comparison with similar homes in the area
Home Values in the Area
Average Home Value in this Area
Purchase History
| Date | Buyer | Sale Price | Title Company |
|---|---|---|---|
| Moncuse Jennifer | -- | -- | |
| Moncuse Robert | $200,000 | -- |
Source: Public Records
Mortgage History
| Date | Status | Borrower | Loan Amount |
|---|---|---|---|
| Previous Owner | Moncuse Robert | $202,441 | |
| Previous Owner | Moncuse Robert | $194,000 |
Source: Public Records
Tax History
| Year | Tax Paid | Tax Assessment Tax Assessment Total Assessment is a certain percentage of the fair market value that is determined by local assessors to be the total taxable value of land and additions on the property. | Land | Improvement |
|---|---|---|---|---|
| 2025 | $6,230 | $179,800 | $52,900 | $126,900 |
| 2024 | $6,079 | $179,800 | $52,900 | $126,900 |
| 2023 | $5,980 | $179,800 | $52,900 | $126,900 |
| 2022 | $5,500 | $179,800 | $52,900 | $126,900 |
| 2021 | $5,386 | $144,090 | $41,760 | $102,330 |
| 2020 | $5,386 | $144,090 | $41,760 | $102,330 |
| 2019 | $5,386 | $144,090 | $41,760 | $102,330 |
| 2018 | $5,266 | $144,090 | $41,760 | $102,330 |
| 2017 | $4,983 | $144,090 | $41,760 | $102,330 |
| 2016 | $4,984 | $146,540 | $46,770 | $99,770 |
| 2015 | $4,842 | $146,540 | $46,770 | $99,770 |
| 2014 | $4,730 | $146,540 | $46,770 | $99,770 |
Source: Public Records
Map
Nearby Homes
- 27 Booth St
- 59 Brookside Village Unit 59
- 24 Herbert St
- 158 Homestead Blvd
- 141 Lincoln Rd
- 3 Bouvier St
- 54 Brainard Rd
- 357 Maple Rd
- 35 Bernardino Ave
- 3 Magnolia Dr
- 20 Manning Rd
- 9 Foxcroft Rd
- 7 Pine Grove Ave
- Lot 114 Bark Haul Rd
- 56 Liberty Ln
- 46 Liberty Ln
- 43 Liberty Ln
- 41 Liberty Ln
- 59 Liberty Ln
- 44 Liberty Ln
Your Personal Tour Guide
Ask me questions while you tour the home.