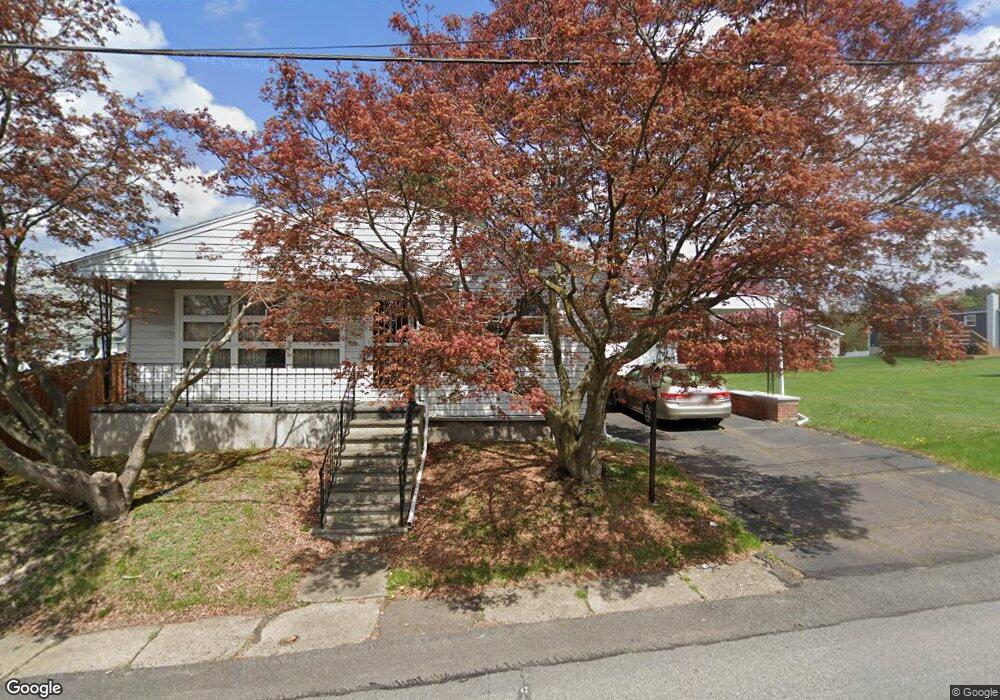
17 Brader St Wilkes Barre, PA 18705
Estimated Value: $83,000 - $287,543
3
Beds
2
Baths
1,200
Sq Ft
$183/Sq Ft
Est. Value
About This Home
This home is located at 17 Brader St, Wilkes Barre, PA 18705 and is currently estimated at $219,886, approximately $183 per square foot. 17 Brader St is a home located in Luzerne County with nearby schools including Leo E. Solomon-Plains Elementary School, Cradock Middle School, and Solomon/Plains Junior High School.
Ownership History
Date
Name
Owned For
Owner Type
Purchase Details
Closed on
Jul 9, 2019
Sold by
Baranski Brian and Gavin John
Bought by
Benners Charles H
Current Estimated Value
Home Financials for this Owner
Home Financials are based on the most recent Mortgage that was taken out on this home.
Original Mortgage
$150,000
Interest Rate
3.9%
Mortgage Type
VA
Purchase Details
Closed on
Mar 22, 2018
Sold by
Us Bank Na
Bought by
Baranski Brian and Gavin John
Purchase Details
Closed on
Dec 20, 2017
Sold by
Pasternak Joseph J and Pasternak Sherie L
Bought by
U S Bank National Association and Structured Asset Investment Loan Trust
Purchase Details
Closed on
Apr 24, 2000
Bought by
Pasternak Joseph J
Create a Home Valuation Report for This Property
The Home Valuation Report is an in-depth analysis detailing your home's value as well as a comparison with similar homes in the area
Home Values in the Area
Average Home Value in this Area
Purchase History
| Date | Buyer | Sale Price | Title Company |
|---|---|---|---|
| Benners Charles H | $150,000 | None Available | |
| Baranski Brian | -- | None Available | |
| U S Bank National Association | $55,000 | None Available | |
| Pasternak Joseph J | $66,000 | -- |
Source: Public Records
Mortgage History
| Date | Status | Borrower | Loan Amount |
|---|---|---|---|
| Previous Owner | Benners Charles H | $150,000 |
Source: Public Records
Tax History Compared to Growth
Tax History
| Year | Tax Paid | Tax Assessment Tax Assessment Total Assessment is a certain percentage of the fair market value that is determined by local assessors to be the total taxable value of land and additions on the property. | Land | Improvement |
|---|---|---|---|---|
| 2025 | $268 | $10,000 | $10,000 | $0 |
| 2024 | $268 | $10,000 | $10,000 | $0 |
| 2023 | $268 | $10,000 | $10,000 | $0 |
| 2022 | $266 | $10,000 | $10,000 | $0 |
| 2021 | $266 | $10,000 | $10,000 | $0 |
| 2020 | $2,745 | $103,300 | $17,500 | $85,800 |
| 2019 | $2,663 | $103,300 | $17,500 | $85,800 |
| 2018 | $2,602 | $103,300 | $17,500 | $85,800 |
| 2017 | $2,541 | $103,300 | $17,500 | $85,800 |
| 2016 | -- | $103,300 | $17,500 | $85,800 |
| 2015 | $2,046 | $103,300 | $17,500 | $85,800 |
| 2014 | $2,046 | $103,300 | $17,500 | $85,800 |
Source: Public Records
Map
Nearby Homes
- 185 N Main St
- 489 N Main St
- 29 Birch Ave
- 12 E Carey St
- 20 Crow St
- 9 Mack St
- 98 Stark St
- 2 Driftwood Dr
- 15 Price St
- 102 E Main Rear St
- 220 Saint Clair St
- 12 Mayock St
- 11 Mayock St
- 9 Mayock St
- 13 Mayock St
- 10 Mayock St
- 1326 N Washington St Unit PORTFOLIO 3 BUILDING
- 18 Center St
- 1471 Wyoming Ave
- 221 E Thomas St