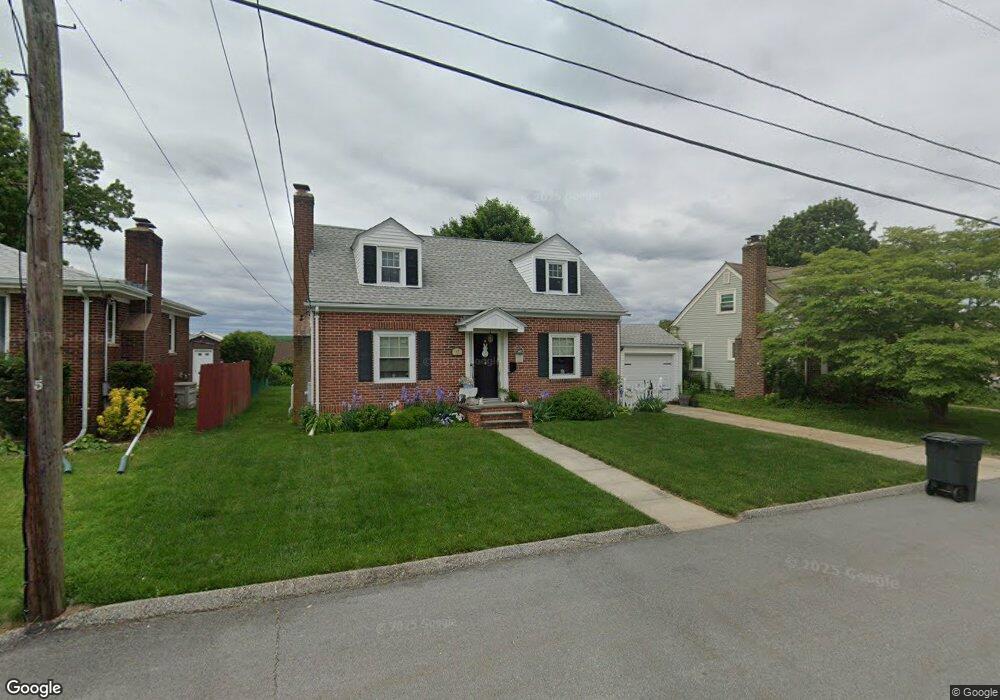
17 Brentwood Dr Johnston, RI 02919
Hartford Avenue NeighborhoodEstimated Value: $386,096 - $440,000
3
Beds
1
Bath
1,229
Sq Ft
$342/Sq Ft
Est. Value
About This Home
This home is located at 17 Brentwood Dr, Johnston, RI 02919 and is currently estimated at $420,774, approximately $342 per square foot. 17 Brentwood Dr is a home located in Providence County with nearby schools including Johnston Senior High School, Achievement First Promesa, and Achievement First Providence Mayoral Academy Elementary.
Ownership History
Date
Name
Owned For
Owner Type
Purchase Details
Closed on
Jan 14, 2016
Sold by
Ingegneri Sally A and Ingegneri Brandon J
Bought by
Ingegneri Sally A
Current Estimated Value
Home Financials for this Owner
Home Financials are based on the most recent Mortgage that was taken out on this home.
Original Mortgage
$125,000
Outstanding Balance
$98,666
Interest Rate
3.65%
Estimated Equity
$322,108
Purchase Details
Closed on
Jun 27, 2014
Sold by
Ingegneri Sally A
Bought by
Ingegeri Brandon J
Purchase Details
Closed on
Dec 23, 2009
Sold by
Ingegneri Sally A
Bought by
Ingegneri Sally A and Ingegneri Brandon
Purchase Details
Closed on
Aug 1, 1995
Sold by
Ingegneri Joseph F and Ingegneri Geraldine
Bought by
Ingegneri Sally A
Create a Home Valuation Report for This Property
The Home Valuation Report is an in-depth analysis detailing your home's value as well as a comparison with similar homes in the area
Home Values in the Area
Average Home Value in this Area
Purchase History
| Date | Buyer | Sale Price | Title Company |
|---|---|---|---|
| Ingegneri Sally A | -- | -- | |
| Ingegeri Brandon J | -- | -- | |
| Ingegneri Sally A | -- | -- | |
| Ingegneri Sally A | -- | -- | |
| Ingegneri Sally A | $90,000 | -- | |
| Ingegneri Sally A | -- | -- | |
| Ingegneri Sally A | -- | -- | |
| Ingegneri Sally A | -- | -- | |
| Ingegneri Sally A | $90,000 | -- |
Source: Public Records
Mortgage History
| Date | Status | Borrower | Loan Amount |
|---|---|---|---|
| Open | Ingegneri Sally A | $125,000 | |
| Previous Owner | Ingegneri Sally A | $130,000 |
Source: Public Records
Tax History Compared to Growth
Tax History
| Year | Tax Paid | Tax Assessment Tax Assessment Total Assessment is a certain percentage of the fair market value that is determined by local assessors to be the total taxable value of land and additions on the property. | Land | Improvement |
|---|---|---|---|---|
| 2025 | $4,561 | $292,000 | $84,300 | $207,700 |
| 2024 | $4,468 | $292,000 | $84,300 | $207,700 |
| 2023 | $4,468 | $292,000 | $84,300 | $207,700 |
| 2022 | $2,408 | $179,500 | $62,400 | $117,100 |
| 2021 | $4,172 | $179,500 | $62,400 | $117,100 |
| 2018 | $4,134 | $150,400 | $46,500 | $103,900 |
| 2016 | $5,470 | $150,400 | $46,500 | $103,900 |
| 2015 | $3,803 | $131,200 | $46,900 | $84,300 |
| 2014 | $3,018 | $131,200 | $46,900 | $84,300 |
| 2013 | $3,772 | $131,200 | $46,900 | $84,300 |
Source: Public Records
Map
Nearby Homes