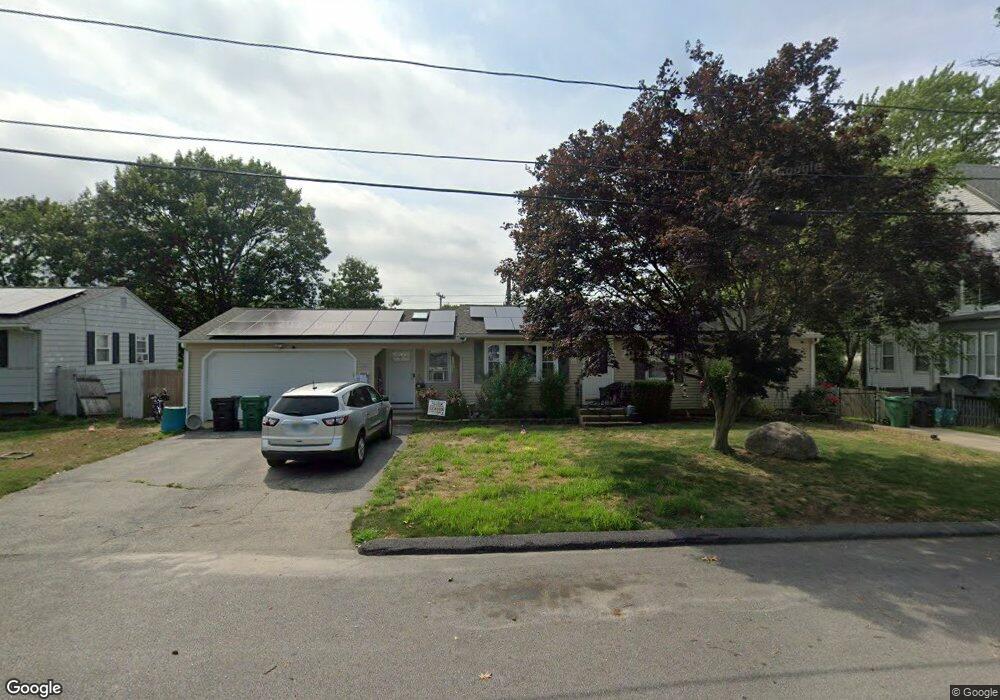
17 Broad St Warwick, RI 02888
Norwood NeighborhoodEstimated Value: $388,000 - $414,678
3
Beds
2
Baths
1,218
Sq Ft
$330/Sq Ft
Est. Value
About This Home
This home is located at 17 Broad St, Warwick, RI 02888 and is currently estimated at $401,670, approximately $329 per square foot. 17 Broad St is a home located in Kent County with nearby schools including St. Peter School.
Ownership History
Date
Name
Owned For
Owner Type
Purchase Details
Closed on
Oct 19, 2018
Sold by
Ronald T Sears Sr Lt and Carroll
Bought by
Olivera Brian M and Olivera Heather J
Current Estimated Value
Purchase Details
Closed on
Sep 25, 2017
Sold by
Sears Ronald T
Bought by
Ronald T Sears Sr Lt and Sears
Purchase Details
Closed on
May 18, 1999
Sold by
Demarco Russell and Demarco Donna M
Bought by
Sears Ronald T and Sears Helen J
Create a Home Valuation Report for This Property
The Home Valuation Report is an in-depth analysis detailing your home's value as well as a comparison with similar homes in the area
Home Values in the Area
Average Home Value in this Area
Purchase History
| Date | Buyer | Sale Price | Title Company |
|---|---|---|---|
| Olivera Brian M | -- | -- | |
| Ronald T Sears Sr Lt | -- | -- | |
| Sears Ronald T | $96,000 | -- |
Source: Public Records
Mortgage History
| Date | Status | Borrower | Loan Amount |
|---|---|---|---|
| Previous Owner | Sears Ronald T | $136,000 |
Source: Public Records
Tax History
| Year | Tax Paid | Tax Assessment Tax Assessment Total Assessment is a certain percentage of the fair market value that is determined by local assessors to be the total taxable value of land and additions on the property. | Land | Improvement |
|---|---|---|---|---|
| 2025 | $4,436 | $349,300 | $99,200 | $250,100 |
| 2024 | $4,382 | $302,800 | $86,200 | $216,600 |
| 2023 | $4,297 | $302,800 | $86,200 | $216,600 |
| 2022 | $4,081 | $217,900 | $57,300 | $160,600 |
| 2021 | $4,081 | $217,900 | $57,300 | $160,600 |
| 2020 | $4,081 | $217,900 | $57,300 | $160,600 |
| 2019 | $4,081 | $217,900 | $57,300 | $160,600 |
| 2018 | $3,521 | $169,300 | $57,300 | $112,000 |
| 2017 | $3,427 | $169,300 | $57,300 | $112,000 |
| 2016 | $3,427 | $169,300 | $57,300 | $112,000 |
| 2015 | $3,245 | $156,400 | $57,000 | $99,400 |
| 2014 | $3,137 | $156,400 | $57,000 | $99,400 |
| 2013 | $3,095 | $156,400 | $57,000 | $99,400 |
Source: Public Records
Map
Nearby Homes
- 22 Phillips Ave
- 27 Frederick St
- 35 Welfare Ave
- 175 Pettaconsett Ave
- 123 Harrington Ave
- 0 Elmwood Ave
- 150 Riverside Ave
- 1052 Post Rd
- 103 Harper Ave
- 80 George St
- 167 Forest Ave
- 859 Pontiac Ave
- 64 Holburn Ave
- 33 Hemlock Ave
- 821 Post Rd
- 10 Woburn St
- 136 Sherwood Ave
- 120 Sherwood Ave
- 127 Sherwood Ave
- 111 Sherwood Ave
Your Personal Tour Guide
Ask me questions while you tour the home.