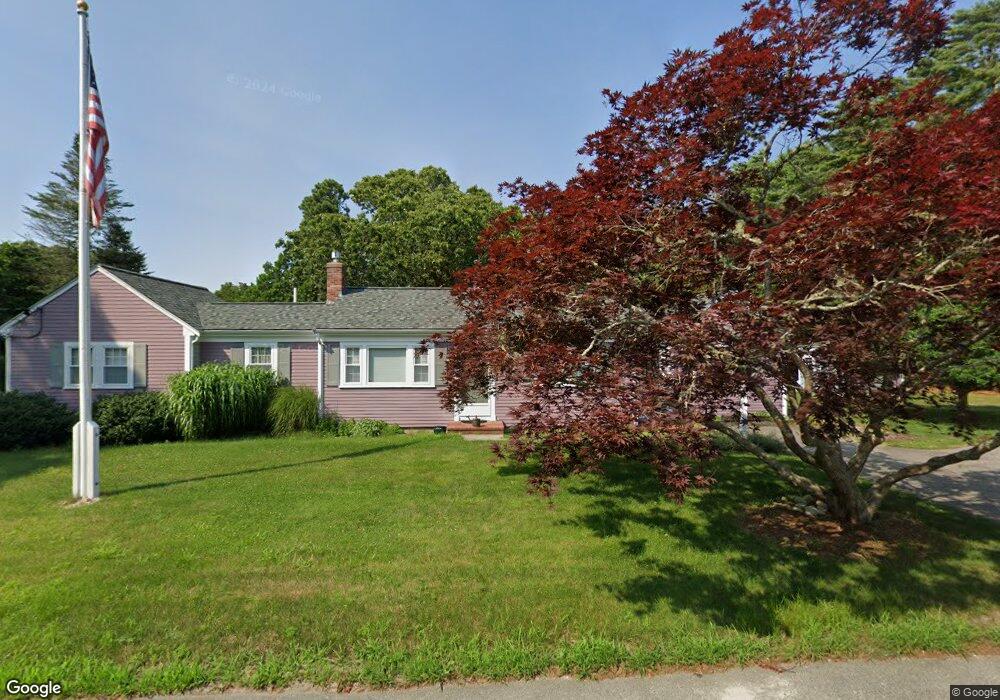
17 Brooks Rd Bourne, MA 02532
Monument Beach NeighborhoodEstimated Value: $571,000 - $642,000
2
Beds
2
Baths
1,200
Sq Ft
$505/Sq Ft
Est. Value
About This Home
This home is located at 17 Brooks Rd, Bourne, MA 02532 and is currently estimated at $606,216, approximately $505 per square foot. 17 Brooks Rd is a home located in Barnstable County with nearby schools including Bourne High School, St Margaret Regional School, and Cadence Academy Preschool - Bourne.
Ownership History
Date
Name
Owned For
Owner Type
Purchase Details
Closed on
Oct 31, 1996
Sold by
Alcott Bonnie L
Bought by
Parece Danielle M and Parece Annette T
Current Estimated Value
Home Financials for this Owner
Home Financials are based on the most recent Mortgage that was taken out on this home.
Original Mortgage
$84,000
Outstanding Balance
$7,130
Interest Rate
8.07%
Mortgage Type
Purchase Money Mortgage
Estimated Equity
$599,086
Purchase Details
Closed on
May 27, 1994
Sold by
Perrault & Son Bldg
Bought by
Alcott Bonnie L
Home Financials for this Owner
Home Financials are based on the most recent Mortgage that was taken out on this home.
Original Mortgage
$89,468
Interest Rate
8.22%
Mortgage Type
Purchase Money Mortgage
Create a Home Valuation Report for This Property
The Home Valuation Report is an in-depth analysis detailing your home's value as well as a comparison with similar homes in the area
Home Values in the Area
Average Home Value in this Area
Purchase History
| Date | Buyer | Sale Price | Title Company |
|---|---|---|---|
| Parece Danielle M | $105,000 | -- | |
| Parece Danielle M | $105,000 | -- | |
| Alcott Bonnie L | $105,500 | -- | |
| Alcott Bonnie L | $105,500 | -- |
Source: Public Records
Mortgage History
| Date | Status | Borrower | Loan Amount |
|---|---|---|---|
| Open | Parece Danielle M | $84,000 | |
| Closed | Alcott Bonnie L | $84,000 | |
| Previous Owner | Alcott Bonnie L | $89,468 |
Source: Public Records
Tax History
| Year | Tax Paid | Tax Assessment Tax Assessment Total Assessment is a certain percentage of the fair market value that is determined by local assessors to be the total taxable value of land and additions on the property. | Land | Improvement |
|---|---|---|---|---|
| 2025 | $4,391 | $562,200 | $208,400 | $353,800 |
| 2024 | $4,293 | $535,300 | $198,500 | $336,800 |
| 2023 | $4,173 | $473,700 | $175,600 | $298,100 |
| 2022 | $3,988 | $395,200 | $155,400 | $239,800 |
| 2021 | $3,876 | $359,900 | $141,500 | $218,400 |
| 2020 | $3,749 | $349,100 | $140,100 | $209,000 |
| 2019 | $3,443 | $327,600 | $127,900 | $199,700 |
| 2018 | $3,125 | $296,500 | $121,900 | $174,600 |
| 2017 | $2,843 | $276,000 | $120,700 | $155,300 |
| 2016 | $2,571 | $253,100 | $120,700 | $132,400 |
| 2015 | $2,549 | $253,100 | $120,700 | $132,400 |
Source: Public Records
Map
Nearby Homes
- 203 County Rd
- 566 Shore Rd
- 35 Benedict Rd
- 13 Laurel Hill Ct
- 16 Amberwood Ct
- 12 Turnberry Rd Unit 12
- 2 Applewood Ct
- 5 Zoli Ln
- 5 Sea Knoll Ct
- 5 Harbor Hill Dr
- 4 Harbor Hill Dr
- 4 Hollyhock Knoll Ct Unit 4
- 4 Hollyhock Knoll Ct Unit 4
- 20 Colony Ave
- 60 Bourne Neck Dr
- 44 Cotuit Rd
- 14 Navajo Rd
- 60 Sandwich Rd
- 46 Holt Rd Unit B
- 46 Holt Rd
Your Personal Tour Guide
Ask me questions while you tour the home.