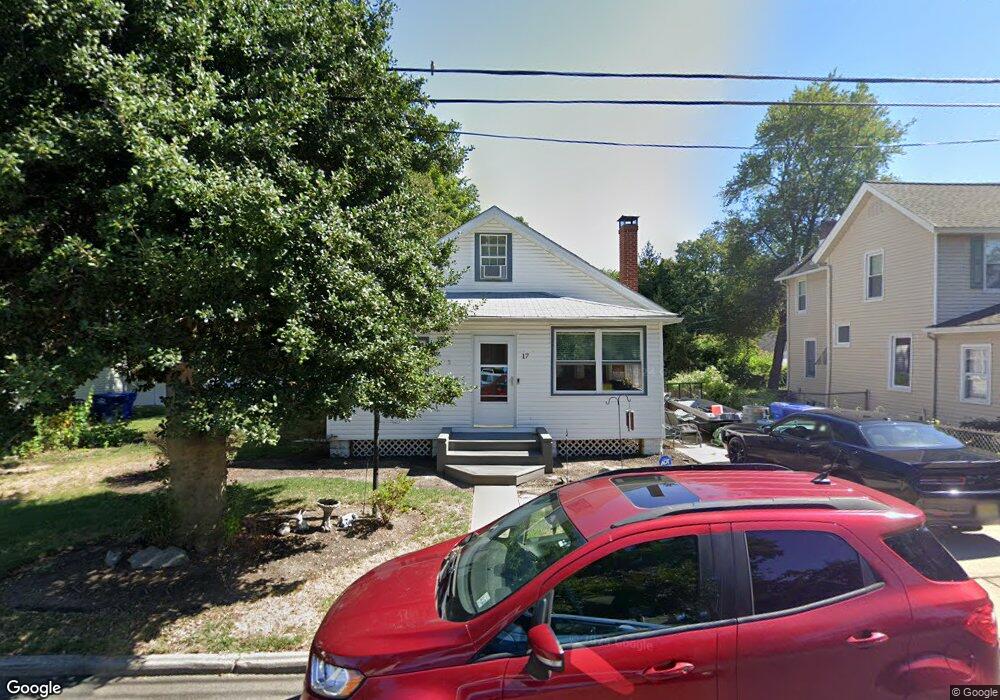
17 Bunting Ave Burlington, NJ 08016
Estimated Value: $281,678 - $353,000
3
Beds
1
Bath
1,076
Sq Ft
$289/Sq Ft
Est. Value
About This Home
This home is located at 17 Bunting Ave, Burlington, NJ 08016 and is currently estimated at $311,420, approximately $289 per square foot. 17 Bunting Ave is a home located in Burlington County with nearby schools including B Bernice Young Elementary School, Fountain Woods Elementary School, and Burlington Township Middle School at Springside.
Ownership History
Date
Name
Owned For
Owner Type
Purchase Details
Closed on
Mar 11, 2011
Sold by
Mazzella Dale
Bought by
Carty Jeffrey John and Carty Andrea Marie
Current Estimated Value
Purchase Details
Closed on
Mar 27, 2009
Sold by
Mazzella Dale
Bought by
Mazzella Dale and Carty Jeffrey John
Purchase Details
Closed on
Sep 17, 2008
Sold by
Greco Terri
Bought by
Mazzella Dale
Home Financials for this Owner
Home Financials are based on the most recent Mortgage that was taken out on this home.
Original Mortgage
$169,650
Interest Rate
5.83%
Mortgage Type
Purchase Money Mortgage
Purchase Details
Closed on
Jul 25, 2002
Sold by
Dey Donald K and Dey Diane L
Bought by
Greco Terri
Home Financials for this Owner
Home Financials are based on the most recent Mortgage that was taken out on this home.
Original Mortgage
$123,900
Interest Rate
6.58%
Create a Home Valuation Report for This Property
The Home Valuation Report is an in-depth analysis detailing your home's value as well as a comparison with similar homes in the area
Home Values in the Area
Average Home Value in this Area
Purchase History
| Date | Buyer | Sale Price | Title Company |
|---|---|---|---|
| Carty Jeffrey John | -- | None Available | |
| Mazzella Dale | -- | None Available | |
| Mazzella Dale | $195,000 | Surety Title Corporation | |
| Greco Terri | $149,900 | Lawyers Title Insurance Corp |
Source: Public Records
Mortgage History
| Date | Status | Borrower | Loan Amount |
|---|---|---|---|
| Previous Owner | Mazzella Dale | $169,650 | |
| Previous Owner | Greco Terri | $123,900 |
Source: Public Records
Tax History Compared to Growth
Tax History
| Year | Tax Paid | Tax Assessment Tax Assessment Total Assessment is a certain percentage of the fair market value that is determined by local assessors to be the total taxable value of land and additions on the property. | Land | Improvement |
|---|---|---|---|---|
| 2025 | $5,130 | $169,200 | $45,800 | $123,400 |
| 2024 | $5,054 | $169,200 | $45,800 | $123,400 |
| 2023 | $5,054 | $169,200 | $45,800 | $123,400 |
| 2022 | $5,032 | $169,200 | $45,800 | $123,400 |
| 2021 | $5,083 | $169,200 | $45,800 | $123,400 |
| 2020 | $5,071 | $169,200 | $45,800 | $123,400 |
| 2019 | $5,083 | $169,200 | $45,800 | $123,400 |
| 2018 | $5,007 | $169,200 | $45,800 | $123,400 |
| 2017 | $4,976 | $169,200 | $45,800 | $123,400 |
| 2016 | $4,599 | $153,300 | $43,800 | $109,500 |
| 2015 | $4,519 | $153,300 | $43,800 | $109,500 |
| 2014 | $4,354 | $153,300 | $43,800 | $109,500 |
Source: Public Records
Map
Nearby Homes
- 1600 Mount Holly Rd
- 1605 Burlington Mt Holly Rd
- 11 Wellington Place
- 15 18th St
- 73 Mill Rd
- 126 E 7th St
- 93 Wellington Place
- 152 E 7th St
- 1110 Pope St
- 0 & 20th Boudinot
- 802 Garnet Dr Unit 8B
- 29 E 4th St
- 800 High St
- 828 Wood St
- 5 Primrose Dr
- 402 Sunset Rd
- 241 Mill Rd
- 2031 Sylvan Park Rd
- 2 Spruce Rd
- 783 Lincoln Ave