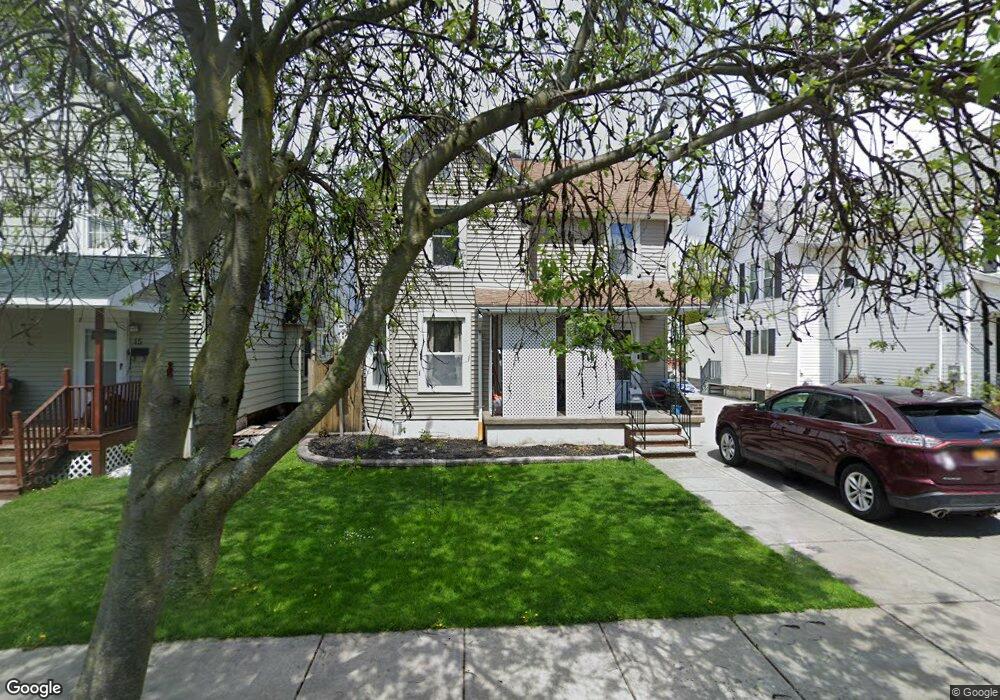
17 Cady St Auburn, NY 13021
Estimated Value: $170,000 - $183,207
4
Beds
2
Baths
1,790
Sq Ft
$98/Sq Ft
Est. Value
About This Home
This home is located at 17 Cady St, Auburn, NY 13021 and is currently estimated at $175,802, approximately $98 per square foot. 17 Cady St is a home located in Cayuga County with nearby schools including Auburn Junior High School, Auburn High School, and St. Joseph School.
Ownership History
Date
Name
Owned For
Owner Type
Purchase Details
Closed on
Apr 17, 2015
Sold by
Depalma Carl J
Bought by
Foxcroft Steven
Current Estimated Value
Home Financials for this Owner
Home Financials are based on the most recent Mortgage that was taken out on this home.
Original Mortgage
$72,400
Outstanding Balance
$54,718
Interest Rate
3.72%
Mortgage Type
Future Advance Clause Open End Mortgage
Estimated Equity
$121,084
Purchase Details
Closed on
Nov 10, 2008
Sold by
Depalma Monica
Bought by
Depalma Carl
Purchase Details
Closed on
Feb 13, 2008
Sold by
Depalma Monica
Bought by
Depalma Carl
Create a Home Valuation Report for This Property
The Home Valuation Report is an in-depth analysis detailing your home's value as well as a comparison with similar homes in the area
Home Values in the Area
Average Home Value in this Area
Purchase History
| Date | Buyer | Sale Price | Title Company |
|---|---|---|---|
| Foxcroft Steven | $90,500 | Dominic Giacona | |
| Foxcroft Steven R | $90,500 | None Available | |
| Depalma Carl | -- | Carl Depalma | |
| Depalma Carl | -- | Carl Depalma |
Source: Public Records
Mortgage History
| Date | Status | Borrower | Loan Amount |
|---|---|---|---|
| Open | Foxcroft Steven R | $72,400 |
Source: Public Records
Tax History
| Year | Tax Paid | Tax Assessment Tax Assessment Total Assessment is a certain percentage of the fair market value that is determined by local assessors to be the total taxable value of land and additions on the property. | Land | Improvement |
|---|---|---|---|---|
| 2025 | $2,802 | $120,200 | $12,700 | $107,500 |
| 2024 | $2,802 | $120,200 | $12,700 | $107,500 |
| 2023 | $2,799 | $120,200 | $12,700 | $107,500 |
| 2022 | $2,784 | $120,200 | $12,700 | $107,500 |
| 2021 | $2,433 | $88,800 | $11,100 | $77,700 |
| 2020 | $2,403 | $88,800 | $11,100 | $77,700 |
| 2019 | $755 | $88,800 | $11,100 | $77,700 |
| 2018 | $2,413 | $88,800 | $11,100 | $77,700 |
| 2017 | $2,559 | $93,500 | $11,700 | $81,800 |
| 2016 | $3,117 | $93,500 | $11,700 | $81,800 |
| 2015 | $790 | $93,500 | $11,700 | $81,800 |
| 2014 | $790 | $93,500 | $11,700 | $81,800 |
Source: Public Records
Map
Nearby Homes
Your Personal Tour Guide
Ask me questions while you tour the home.