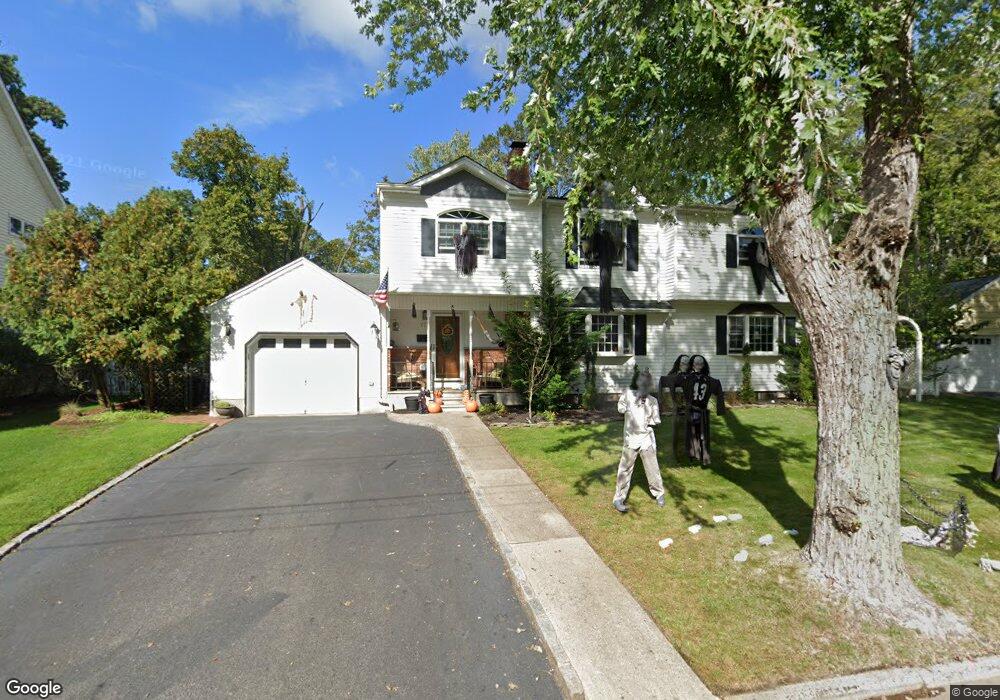
17 Cathy Ln Waldwick, NJ 07463
Estimated Value: $843,000 - $1,048,000
5
Beds
3
Baths
2,738
Sq Ft
$342/Sq Ft
Est. Value
About This Home
This home is located at 17 Cathy Ln, Waldwick, NJ 07463 and is currently estimated at $935,690, approximately $341 per square foot. 17 Cathy Ln is a home located in Bergen County with nearby schools including Waldwick High School, Waldwick Seventh-Day Adventist School, and The Forum School.
Ownership History
Date
Name
Owned For
Owner Type
Purchase Details
Closed on
Aug 10, 2018
Sold by
Caserta Christopher and Casterta Wendy
Bought by
Caserta Christopher
Current Estimated Value
Home Financials for this Owner
Home Financials are based on the most recent Mortgage that was taken out on this home.
Original Mortgage
$475,000
Outstanding Balance
$412,518
Interest Rate
4.5%
Mortgage Type
Purchase Money Mortgage
Estimated Equity
$523,172
Purchase Details
Closed on
May 30, 2014
Sold by
Caserta Ralph Victor and Caserta Katherine P
Bought by
Caserta Christopher and Caserta Wendy
Home Financials for this Owner
Home Financials are based on the most recent Mortgage that was taken out on this home.
Original Mortgage
$400,000
Interest Rate
4.27%
Mortgage Type
New Conventional
Create a Home Valuation Report for This Property
The Home Valuation Report is an in-depth analysis detailing your home's value as well as a comparison with similar homes in the area
Home Values in the Area
Average Home Value in this Area
Purchase History
| Date | Buyer | Sale Price | Title Company |
|---|---|---|---|
| Caserta Christopher | $104,500 | -- | |
| Caserta Christopher | $600,000 | -- |
Source: Public Records
Mortgage History
| Date | Status | Borrower | Loan Amount |
|---|---|---|---|
| Open | Caserta Christopher | $475,000 | |
| Previous Owner | Caserta Christopher | $400,000 |
Source: Public Records
Tax History Compared to Growth
Tax History
| Year | Tax Paid | Tax Assessment Tax Assessment Total Assessment is a certain percentage of the fair market value that is determined by local assessors to be the total taxable value of land and additions on the property. | Land | Improvement |
|---|---|---|---|---|
| 2025 | $15,640 | $706,400 | $292,400 | $414,000 |
| 2024 | $14,909 | $706,400 | $292,400 | $414,000 |
| 2023 | $14,602 | $512,700 | $251,900 | $260,800 |
| 2022 | $14,602 | $512,700 | $251,900 | $260,800 |
| 2021 | $14,325 | $512,700 | $251,900 | $260,800 |
| 2020 | $14,186 | $512,700 | $251,900 | $260,800 |
| 2019 | $14,181 | $512,700 | $251,900 | $260,800 |
| 2018 | $13,047 | $487,000 | $251,900 | $235,100 |
| 2017 | $12,935 | $487,000 | $251,900 | $235,100 |
| 2016 | $12,672 | $487,000 | $251,900 | $235,100 |
| 2015 | $12,526 | $487,000 | $251,900 | $235,100 |
| 2014 | $12,224 | $487,000 | $251,900 | $235,100 |
Source: Public Records
Map
Nearby Homes
- 342 Park Ave
- 103 Crescent Ave
- 1-5 Chestnut Place
- 20 van Schaik Ln
- 53 Smithfield Rd
- 39 Edgewood Ave
- 36 Lockwood Dr
- 36 Hemlock St
- 16 Hemlock St
- 34 4th St
- 117 Spruce St
- 137 Elmwood Place
- 24 Scott Ct
- 190 Madison Ave
- 314 Meadowbrook Rd
- 29 Westview Terrace
- 22 Oakwood Rd
- 260 Glen Ave
- 674 N Monroe St
- 723 W Crescent Ave