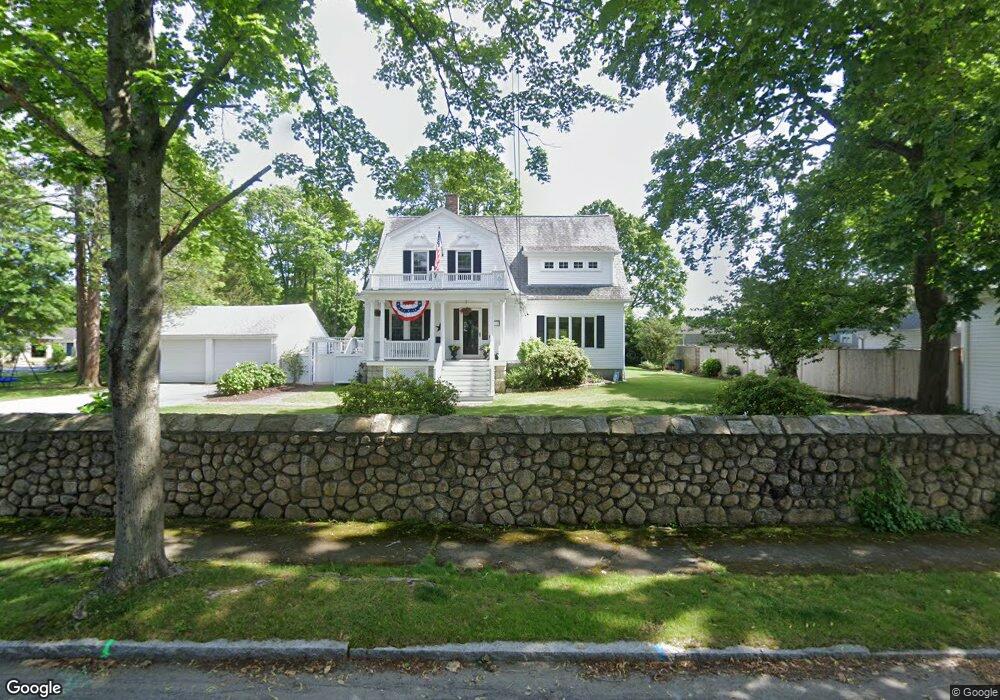
17 Cedar St Fairhaven, MA 02719
Estimated Value: $838,094 - $1,068,000
4
Beds
2
Baths
2,748
Sq Ft
$348/Sq Ft
Est. Value
About This Home
This home is located at 17 Cedar St, Fairhaven, MA 02719 and is currently estimated at $956,774, approximately $348 per square foot. 17 Cedar St is a home located in Bristol County with nearby schools including Fairhaven High School, City On A Hill Charter Public School New Bedford, and St. Joseph School.
Ownership History
Date
Name
Owned For
Owner Type
Purchase Details
Closed on
Feb 18, 2005
Sold by
Holroyd David J and Holroyd Gillian L
Bought by
Gillian L Holroyd T and Holroyd David J
Current Estimated Value
Home Financials for this Owner
Home Financials are based on the most recent Mortgage that was taken out on this home.
Original Mortgage
$492,000
Outstanding Balance
$243,826
Interest Rate
5.78%
Mortgage Type
Purchase Money Mortgage
Estimated Equity
$712,948
Create a Home Valuation Report for This Property
The Home Valuation Report is an in-depth analysis detailing your home's value as well as a comparison with similar homes in the area
Home Values in the Area
Average Home Value in this Area
Purchase History
| Date | Buyer | Sale Price | Title Company |
|---|---|---|---|
| Gillian L Holroyd T | -- | -- | |
| Holroyd David J | $615,000 | -- |
Source: Public Records
Mortgage History
| Date | Status | Borrower | Loan Amount |
|---|---|---|---|
| Open | Holroyd David J | $492,000 | |
| Closed | Holroyd David J | $492,000 | |
| Previous Owner | Holroyd David J | $70,000 |
Source: Public Records
Tax History
| Year | Tax Paid | Tax Assessment Tax Assessment Total Assessment is a certain percentage of the fair market value that is determined by local assessors to be the total taxable value of land and additions on the property. | Land | Improvement |
|---|---|---|---|---|
| 2025 | $77 | $822,400 | $252,900 | $569,500 |
| 2024 | $7,560 | $819,100 | $252,900 | $566,200 |
| 2023 | $7,291 | $732,800 | $218,200 | $514,600 |
| 2022 | $6,922 | $677,300 | $198,800 | $478,500 |
| 2021 | $6,811 | $603,300 | $180,800 | $422,500 |
| 2020 | $6,672 | $603,300 | $180,800 | $422,500 |
| 2019 | $6,508 | $557,700 | $155,000 | $402,700 |
| 2018 | $6,373 | $529,000 | $147,500 | $381,500 |
| 2017 | $6,137 | $509,700 | $141,900 | $367,800 |
| 2016 | $5,598 | $459,600 | $139,200 | $320,400 |
| 2015 | $5,441 | $447,800 | $139,200 | $308,600 |
Source: Public Records
Map
Nearby Homes
- 32 Cedar St
- 32 Green St
- 2 Washburn Ave
- 11 Lawton St
- 24 Middle St
- 58 Washington St
- 0 Nulands Neck Unit 73286360
- 8 Washington St
- 145 Pleasant St
- 8 Manor Dr
- 39 Christian St
- 77 Adams St
- 181 Washington St
- 67 Bridge St
- 58 Bayview Ave
- 27 Bayview Ave
- 15 Bayview Ave
- 138 Main St Unit 13
- 9 Abbott St
- 9 Cleveland St
Your Personal Tour Guide
Ask me questions while you tour the home.