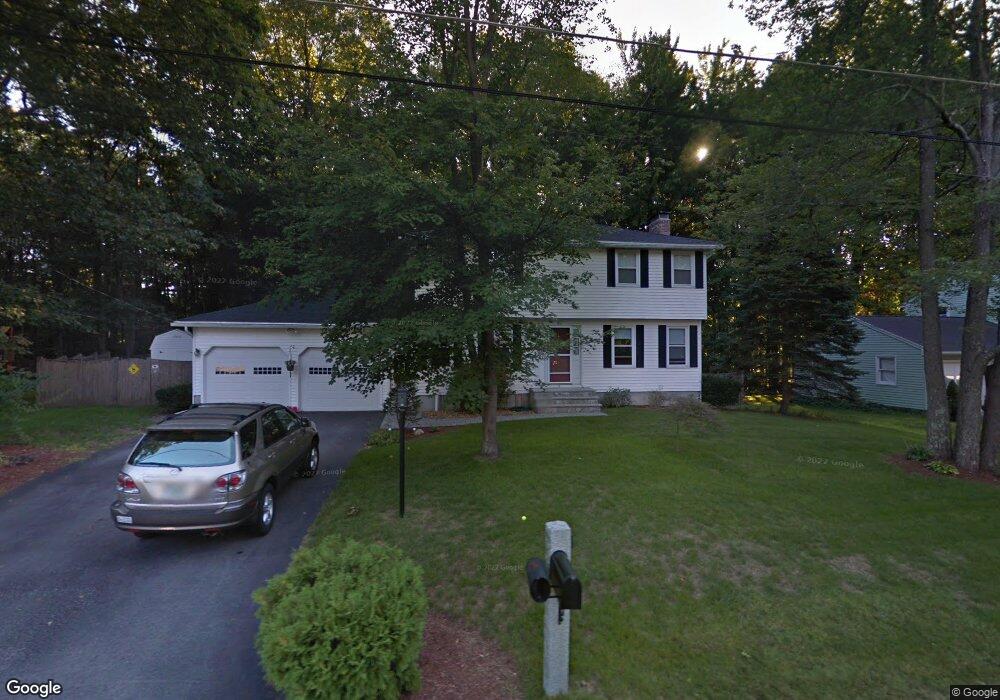
17 Chatham St Nashua, NH 03063
Northwest Nashua NeighborhoodEstimated Value: $524,000 - $553,074
4
Beds
2
Baths
1,666
Sq Ft
$321/Sq Ft
Est. Value
About This Home
This home is located at 17 Chatham St, Nashua, NH 03063 and is currently estimated at $535,269, approximately $321 per square foot. 17 Chatham St is a home located in Hillsborough County with nearby schools including Charlotte Ave Elementary School, Pennichuck Middle School, and Nashua High School North.
Ownership History
Date
Name
Owned For
Owner Type
Purchase Details
Closed on
Jul 10, 2000
Sold by
Snapper Lewis and Snapper Debrah A
Bought by
Savage Christopher J and Savage Alyse
Current Estimated Value
Home Financials for this Owner
Home Financials are based on the most recent Mortgage that was taken out on this home.
Original Mortgage
$100,000
Interest Rate
8.55%
Mortgage Type
Purchase Money Mortgage
Create a Home Valuation Report for This Property
The Home Valuation Report is an in-depth analysis detailing your home's value as well as a comparison with similar homes in the area
Home Values in the Area
Average Home Value in this Area
Purchase History
| Date | Buyer | Sale Price | Title Company |
|---|---|---|---|
| Savage Christopher J | $119,000 | -- |
Source: Public Records
Mortgage History
| Date | Status | Borrower | Loan Amount |
|---|---|---|---|
| Open | Savage Christopher J | $244,914 | |
| Closed | Savage Christopher J | $50,000 | |
| Closed | Savage Christopher J | $295,000 | |
| Closed | Savage Christopher J | $100,000 |
Source: Public Records
Tax History
| Year | Tax Paid | Tax Assessment Tax Assessment Total Assessment is a certain percentage of the fair market value that is determined by local assessors to be the total taxable value of land and additions on the property. | Land | Improvement |
|---|---|---|---|---|
| 2025 | $8,227 | $488,800 | $164,600 | $324,200 |
| 2024 | $7,772 | $488,800 | $164,600 | $324,200 |
| 2023 | $7,390 | $405,400 | $131,700 | $273,700 |
| 2022 | $7,326 | $405,400 | $131,700 | $273,700 |
| 2021 | $7,077 | $304,800 | $92,200 | $212,600 |
| 2020 | $6,844 | $302,700 | $92,200 | $210,500 |
| 2019 | $6,587 | $302,700 | $92,200 | $210,500 |
| 2018 | $6,420 | $302,700 | $92,200 | $210,500 |
| 2017 | $6,257 | $242,600 | $71,700 | $170,900 |
| 2016 | $6,082 | $242,600 | $71,700 | $170,900 |
| 2015 | $5,951 | $242,600 | $71,700 | $170,900 |
| 2014 | $5,835 | $242,600 | $71,700 | $170,900 |
Source: Public Records
Map
Nearby Homes
- 6 Duckford Cir Unit U19
- 35 Albury Stone Cir Unit U201
- 5 Dumaine Ave Unit A
- 7 Dumaine Ave Unit H
- 7 Dumaine Ave Unit 7H
- 18 Dumaine Ave Unit C
- 9 Blackstone Dr Unit U88
- 5 Blackstone Dr Unit 7
- 3 Roedean Dr Unit UC101
- 161 Cannongate III
- 9 Juniper Ln
- 2 Westchester Dr
- 10 Vespa Ln
- 60 Pine Hill Rd
- 9 Rugby Rd
- 10 Todd Rd
- 189 Coburn Woods
- 54 Toby Cir
- 10 Westborn Dr
- 111 Coburn Ave Unit 187
- 15 Chatham St
- 19 Chatham St
- 12 Chatham St
- 11 Chatham St
- 10 Chatham St
- 21 Chatham St
- 5 Stanwood Dr
- 3 Stanwood Dr
- 7 Stanwood Dr
- 8 Chatham St
- 9 Chatham St
- 14 York St
- 23 Chatham St
- 13 Bradford St
- 9 Stanwood Dr
- 11 Bradford St
- 42 Andover Down Unit U284
- 4 Stanwood Dr
- 40 Andover Down Unit U283
- 6 Stanwood Dr
Your Personal Tour Guide
Ask me questions while you tour the home.