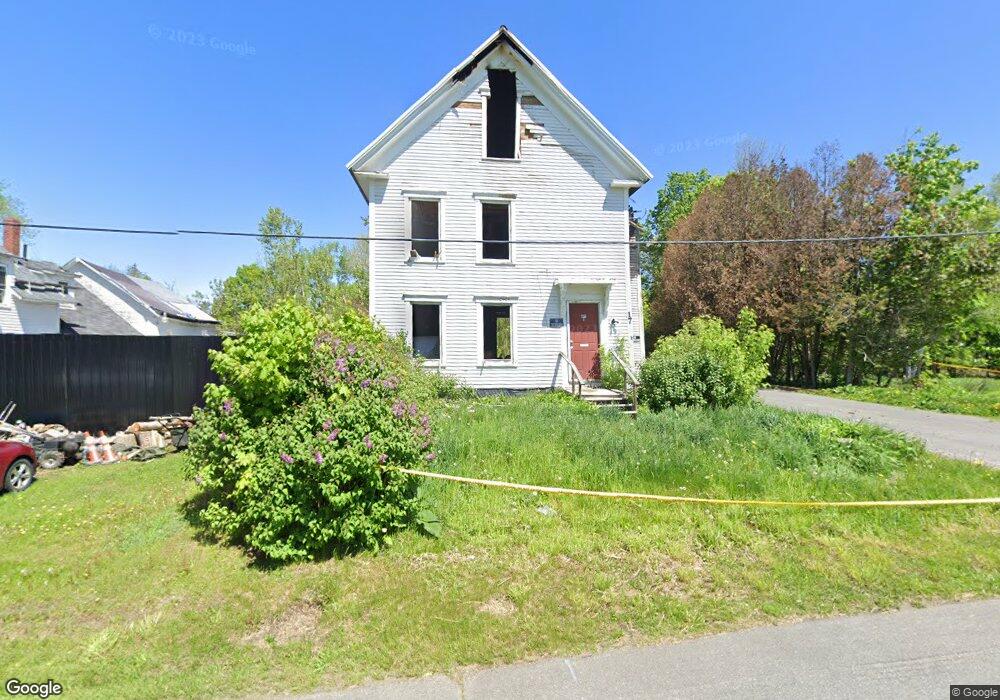
17 Cherry St Dover-Foxcroft, ME 04426
4
Beds
3
Baths
2,196
Sq Ft
26,136
Sq Ft Lot
About This Home
This home is located at 17 Cherry St, Dover-Foxcroft, ME 04426. 17 Cherry St is a home located in Piscataquis County with nearby schools including Se Do Mo Cha Elementary School, Se Do Mo Cha Middle School, and Foxcroft Academy.
Ownership History
Date
Name
Owned For
Owner Type
Purchase Details
Closed on
Dec 15, 2021
Sold by
Brackett Christopher J
Bought by
Brackett Properties Llc
Home Financials for this Owner
Home Financials are based on the most recent Mortgage that was taken out on this home.
Original Mortgage
$130,000
Outstanding Balance
$119,534
Interest Rate
3.09%
Mortgage Type
Purchase Money Mortgage
Purchase Details
Closed on
Oct 25, 2007
Sold by
Keyte Shawn P and Peterson Joy A
Bought by
Maine Highlands Fcu
Create a Home Valuation Report for This Property
The Home Valuation Report is an in-depth analysis detailing your home's value as well as a comparison with similar homes in the area
Home Values in the Area
Average Home Value in this Area
Purchase History
| Date | Buyer | Sale Price | Title Company |
|---|---|---|---|
| Brackett Properties Llc | -- | None Available | |
| Brackett Properties Llc | -- | None Available | |
| Brackett Properties Llc | -- | None Available | |
| Maine Highlands Fcu | $1,001 | -- | |
| Maine Highlands Fcu | $1,001 | -- |
Source: Public Records
Mortgage History
| Date | Status | Borrower | Loan Amount |
|---|---|---|---|
| Open | Brackett Properties Llc | $130,000 | |
| Closed | Brackett Properties Llc | $130,000 | |
| Previous Owner | Maine Highlands Fcu | $72,000 |
Source: Public Records
Tax History
| Year | Tax Paid | Tax Assessment Tax Assessment Total Assessment is a certain percentage of the fair market value that is determined by local assessors to be the total taxable value of land and additions on the property. | Land | Improvement |
|---|---|---|---|---|
| 2024 | $207 | $12,200 | $12,200 | $0 |
| 2023 | $2,098 | $113,100 | $11,200 | $101,900 |
| 2022 | $1,974 | $98,700 | $10,300 | $88,400 |
| 2021 | $1,993 | $92,700 | $9,400 | $83,300 |
| 2020 | $1,984 | $92,700 | $9,400 | $83,300 |
| 2019 | $1,993 | $92,700 | $9,400 | $83,300 |
| 2018 | $1,965 | $92,700 | $9,400 | $83,300 |
| 2017 | $1,937 | $92,700 | $9,400 | $83,300 |
| 2016 | $1,877 | $92,700 | $9,400 | $83,300 |
| 2015 | $1,802 | $96,900 | $9,400 | $87,500 |
| 2014 | $1,768 | $96,900 | $9,400 | $87,500 |
| 2013 | $1,710 | $96,900 | $9,400 | $87,500 |
Source: Public Records
Map
Nearby Homes
Your Personal Tour Guide
Ask me questions while you tour the home.