Estimated Value: $108,767 - $141,000
--
Bed
1
Bath
1,424
Sq Ft
$86/Sq Ft
Est. Value
About This Home
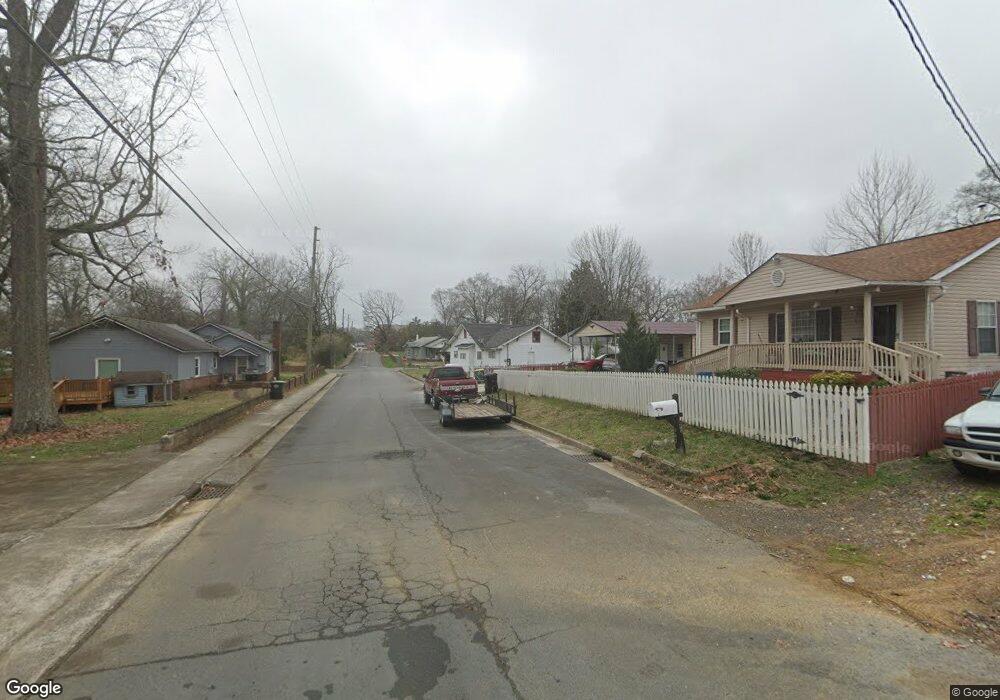
This home is located at 17 Cherry St SW, Rome, GA 30165 and is currently estimated at $122,942, approximately $86 per square foot. 17 Cherry St SW is a home located in Floyd County with nearby schools including Rome High School and St. Mary School.
Ownership History
Date
Name
Owned For
Owner Type
Purchase Details
Closed on
Dec 30, 2004
Sold by
Astin Thomas W and Astin Linda J
Bought by
Reyes Santos S
Current Estimated Value
Purchase Details
Closed on
Aug 29, 1991
Sold by
Hearth Enterprises Inc
Bought by
Astin Thomas W and Astin Linda J
Purchase Details
Closed on
Mar 7, 1991
Sold by
Secretary Of Veterans
Bought by
Hearth Enterprises Inc
Purchase Details
Closed on
Nov 6, 1990
Sold by
World Savings & Loan Assoc
Bought by
Secretary Of Veterans
Purchase Details
Closed on
Feb 13, 1987
Sold by
Dempsey Rebecca and Dempsey Ray
Bought by
Pullen Vivian
Purchase Details
Closed on
Dec 16, 1977
Sold by
P\R
Bought by
Dempsey Rebecca and Dempsey Ray
Purchase Details
Closed on
Jun 14, 1976
Sold by
Scoggins R E
Bought by
Eley Jacqueline L
Purchase Details
Closed on
Oct 9, 1944
Bought by
Scoggins R E
Create a Home Valuation Report for This Property
The Home Valuation Report is an in-depth analysis detailing your home's value as well as a comparison with similar homes in the area
Home Values in the Area
Average Home Value in this Area
Purchase History
| Date | Buyer | Sale Price | Title Company |
|---|---|---|---|
| Reyes Santos S | $51,000 | -- | |
| Reyes Santos S | $51,000 | -- | |
| Astin Thomas W | $30,000 | -- | |
| Hearth Enterprises Inc | $10,100 | -- | |
| Secretary Of Veterans | $11,100 | -- | |
| World Savings & Loan Assoc | $11,100 | -- | |
| Pullen Vivian | $20,500 | -- | |
| Dempsey Rebecca | -- | -- | |
| P\R | $20,300 | -- | |
| Eley Jacqueline L | $20,000 | -- | |
| Scoggins R E | -- | -- |
Source: Public Records
Tax History Compared to Growth
Tax History
| Year | Tax Paid | Tax Assessment Tax Assessment Total Assessment is a certain percentage of the fair market value that is determined by local assessors to be the total taxable value of land and additions on the property. | Land | Improvement |
|---|---|---|---|---|
| 2024 | $1,604 | $41,131 | $5,424 | $35,707 |
| 2023 | $1,457 | $38,923 | $4,821 | $34,102 |
| 2022 | $1,158 | $31,748 | $4,018 | $27,730 |
| 2021 | $1,059 | $28,538 | $4,018 | $24,520 |
| 2020 | $971 | $25,952 | $3,013 | $22,939 |
| 2019 | $901 | $24,347 | $3,013 | $21,334 |
| 2018 | $842 | $22,743 | $3,013 | $19,730 |
| 2017 | $807 | $21,799 | $3,013 | $18,786 |
| 2016 | $834 | $22,448 | $3,000 | $19,448 |
| 2015 | $787 | $22,448 | $3,000 | $19,448 |
| 2014 | $787 | $22,448 | $3,000 | $19,448 |
Source: Public Records
Map
Nearby Homes
- 8 S Hughes St SW
- 204 Cherry St SW
- 8 Leon St SW
- 50 Melton Ave SW
- 0 Mount Alto Rd SW Unit 10523740
- 21 Sweetspire Dr NW
- 23 Sweetspire Dr NW
- 15 Silverbell Ln
- 13 Ridgewood Rd SW
- 14 Berckman Ln SW
- 3 Berckman Ln SW
- 19 Berckman Ln SW
- 214 N Elm St NW
- 40 Paris Dr SW
- 100 Dellwood Dr NW
- 55 Ridgewood Rd SW
- 311 Wilkerson Rd SW
- 313 Wilkerson Rd SW
- 209 Sherwood Rd SW
- 207 Paris Dr SW
- 15 Cherry St SW
- 13 Cherry St SW
- 802 Ethel Ave SW
- 101 Cherry St SW
- 11 Cherry St SW
- 105 Cherry St SW
- 800 Ethel Ave SW
- 9 Cherry St SW
- 18 Cherry St SW
- 102 Cherry St SW
- 14 Cherry St SW
- 107 Cherry St SW
- 7 Cherry St SW
- 798 Ethel Ave SW
- 104 Cherry St SW
- 12 Cherry St SW
- 14 S Hughes St SW
- 12 S Hughes St SW
- 100 S Hughes St SW
- 109 Cherry St SW