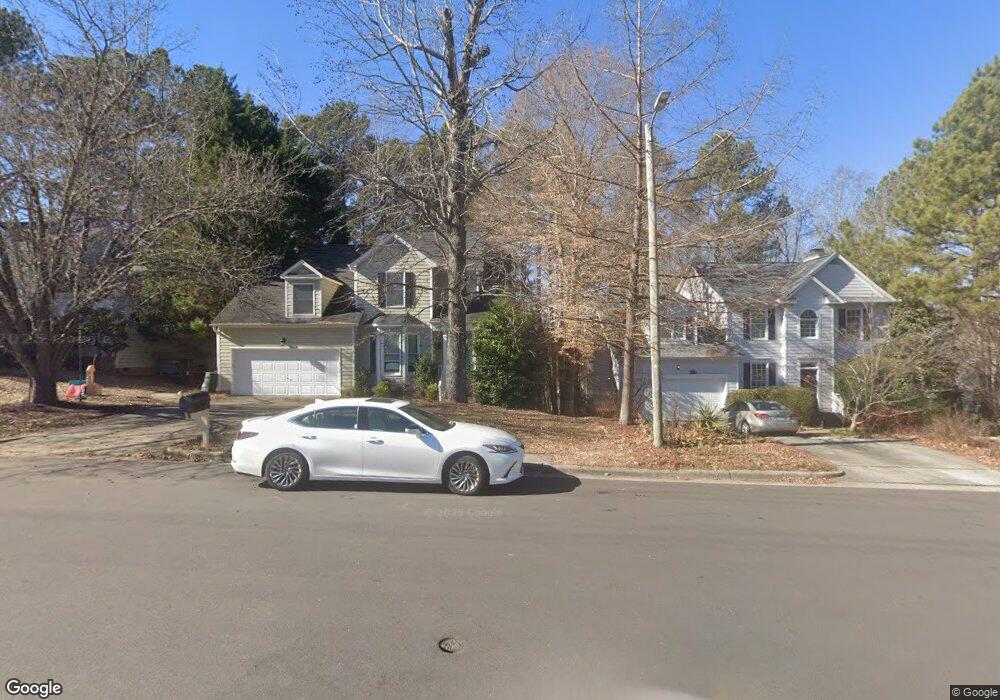
17 Chestnut Bluffs Ln Durham, NC 27713
Woodcroft NeighborhoodEstimated Value: $465,116 - $539,000
4
Beds
3
Baths
1,805
Sq Ft
$279/Sq Ft
Est. Value
About This Home
This home is located at 17 Chestnut Bluffs Ln, Durham, NC 27713 and is currently estimated at $503,529, approximately $278 per square foot. 17 Chestnut Bluffs Ln is a home located in Durham County with nearby schools including Southwest Elementary School, Morehead Montessori, and Sherwood Githens Middle.
Ownership History
Date
Name
Owned For
Owner Type
Purchase Details
Closed on
Aug 12, 2019
Sold by
Kay Cody Delane
Bought by
Godwin Christine Leigh
Current Estimated Value
Home Financials for this Owner
Home Financials are based on the most recent Mortgage that was taken out on this home.
Original Mortgage
$260,000
Outstanding Balance
$227,852
Interest Rate
3.73%
Mortgage Type
New Conventional
Estimated Equity
$275,677
Purchase Details
Closed on
Jun 5, 2017
Sold by
Cody Jerry Roy
Bought by
Cody Delane Kay
Purchase Details
Closed on
Jun 5, 1998
Sold by
Pyle James L and Pyle Jennifer L
Bought by
Cody Jerry R and Cody Delane K
Home Financials for this Owner
Home Financials are based on the most recent Mortgage that was taken out on this home.
Original Mortgage
$155,700
Interest Rate
7.15%
Create a Home Valuation Report for This Property
The Home Valuation Report is an in-depth analysis detailing your home's value as well as a comparison with similar homes in the area
Home Values in the Area
Average Home Value in this Area
Purchase History
| Date | Buyer | Sale Price | Title Company |
|---|---|---|---|
| Godwin Christine Leigh | $325,000 | None Available | |
| Cody Delane Kay | -- | None Available | |
| Cody Jerry R | $173,000 | -- |
Source: Public Records
Mortgage History
| Date | Status | Borrower | Loan Amount |
|---|---|---|---|
| Open | Godwin Christine Leigh | $260,000 | |
| Previous Owner | Cody Jerry R | $155,700 |
Source: Public Records
Tax History
| Year | Tax Paid | Tax Assessment Tax Assessment Total Assessment is a certain percentage of the fair market value that is determined by local assessors to be the total taxable value of land and additions on the property. | Land | Improvement |
|---|---|---|---|---|
| 2025 | $4,995 | $503,930 | $121,000 | $382,930 |
| 2024 | $3,779 | $270,900 | $54,270 | $216,630 |
| 2023 | $3,549 | $270,900 | $54,270 | $216,630 |
| 2022 | $3,467 | $270,900 | $54,270 | $216,630 |
| 2021 | $3,451 | $270,900 | $54,270 | $216,630 |
| 2020 | $3,370 | $270,900 | $54,270 | $216,630 |
| 2019 | $3,370 | $270,900 | $54,270 | $216,630 |
| 2018 | $3,284 | $242,085 | $45,225 | $196,860 |
| 2017 | $3,260 | $242,085 | $45,225 | $196,860 |
| 2016 | $3,150 | $242,085 | $45,225 | $196,860 |
| 2015 | $3,256 | $235,182 | $47,166 | $188,016 |
| 2014 | $3,256 | $235,182 | $47,166 | $188,016 |
Source: Public Records
Map
Nearby Homes
- 2 Hurdle Ct
- 3805 Chimney Ridge Place Unit 104
- 4 Applewood Square
- 10 Hickorywood Square
- 233 Morningside Dr
- 527 Woodwinds Dr
- 5500 Fortunes Ridge Dr Unit 80b
- 5500 Fortunes Ridge Dr Unit 89B
- 3700 Chimney Ridge Place Unit 201
- 708 Sleepy Creek Dr
- 5219 Oakbrook Dr
- 4907 Fortunes Ridge Dr
- 135 Long Shadow Place
- 200 W Woodcroft Pkwy Unit 53b
- 5109 Carolwood Ln
- 212 Old Fox Trail
- 4727 Alderbrook Ln
- 4731 Alderbrook Ln
- 4 Barkridge Ct
- 54 Willow Bridge Dr
- 15 Chestnut Bluffs Ln
- 19 Chestnut Bluffs Ln
- 4 Porters Glen Place
- 2 Porters Glen Place
- 2 Wythebrook Ln
- 20 Chestnut Bluffs Ln
- 8 Porters Glen Place
- 16 Chestnut Bluffs Ln
- 23 Chestnut Bluffs Ln
- 24 Chestnut Bluffs Ln
- 14 Porters Glen Place
- 10 Porters Glen Place
- 14 Chestnut Bluffs Ln
- 4 Wythebrook Ln
- 12 Chestnut Bluffs Ln
- 28 Chestnut Bluffs Ln
- 12 Porters Glen Place
- 9 Chestnut Bluffs Ln
- 6 Wythebrook Ln
- 5 Porters Glen Place
Your Personal Tour Guide
Ask me questions while you tour the home.