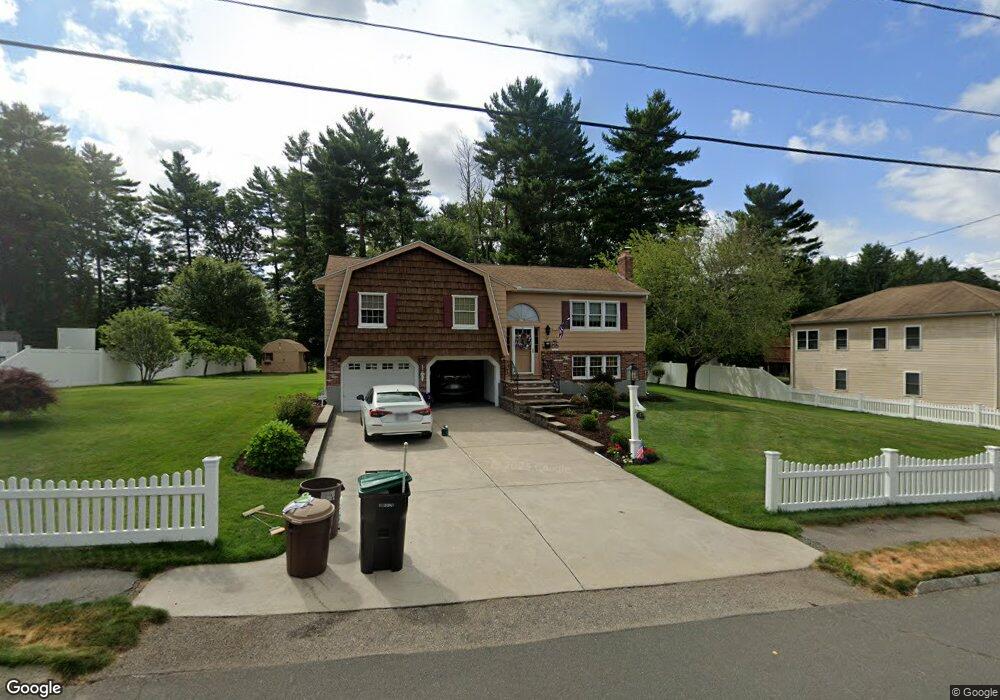
17 Childs Ln Foxboro, MA 02035
Estimated Value: $618,911 - $709,000
3
Beds
3
Baths
1,266
Sq Ft
$531/Sq Ft
Est. Value
About This Home
This home is located at 17 Childs Ln, Foxboro, MA 02035 and is currently estimated at $672,478, approximately $531 per square foot. 17 Childs Ln is a home located in Norfolk County with nearby schools including Foxborough High School, Hands-On-Montessori School, and Cadence Academy Preschool - North Attleborough.
Ownership History
Date
Name
Owned For
Owner Type
Purchase Details
Closed on
Mar 20, 1986
Bought by
Hogan Richard A and Hogan Donna Marie
Current Estimated Value
Create a Home Valuation Report for This Property
The Home Valuation Report is an in-depth analysis detailing your home's value as well as a comparison with similar homes in the area
Home Values in the Area
Average Home Value in this Area
Purchase History
| Date | Buyer | Sale Price | Title Company |
|---|---|---|---|
| Hogan Richard A | -- | -- |
Source: Public Records
Mortgage History
| Date | Status | Borrower | Loan Amount |
|---|---|---|---|
| Open | Hogan Richard A | $91,000 | |
| Closed | Hogan Richard A | $20,000 | |
| Closed | Hogan Richard A | $50,000 |
Source: Public Records
Tax History Compared to Growth
Tax History
| Year | Tax Paid | Tax Assessment Tax Assessment Total Assessment is a certain percentage of the fair market value that is determined by local assessors to be the total taxable value of land and additions on the property. | Land | Improvement |
|---|---|---|---|---|
| 2025 | $7,221 | $546,200 | $253,300 | $292,900 |
| 2024 | $6,952 | $514,600 | $257,900 | $256,700 |
| 2023 | $6,761 | $475,800 | $245,600 | $230,200 |
| 2022 | $6,117 | $421,300 | $205,800 | $215,500 |
| 2021 | $5,710 | $387,400 | $190,600 | $196,800 |
| 2020 | $5,344 | $366,800 | $190,600 | $176,200 |
| 2019 | $5,243 | $356,700 | $181,600 | $175,100 |
| 2018 | $5,111 | $350,800 | $181,600 | $169,200 |
| 2017 | $5,202 | $345,900 | $169,700 | $176,200 |
| 2016 | $5,270 | $355,600 | $171,200 | $184,400 |
| 2015 | $5,049 | $332,400 | $144,800 | $187,600 |
| 2014 | $4,840 | $322,900 | $135,300 | $187,600 |
Source: Public Records
Map
Nearby Homes
- 406 South St
- 24 Maverick Dr
- 16 Treasure Island Rd
- 9 Oak Dr
- 4 Buckskin Dr
- 80 Mill St
- 450 West St
- 116 George St
- 150 Gilbert St
- 126 Washington St
- 130 Washington St
- 124 Washington St
- 28 Messenger St
- 11 Landry Ave
- 10 Sleepy Hollow Cir
- 356 Central St
- 158 Washington St
- 166 Chauncy St
- 5 Old Wood Rd
- 196 Donald Tennant Cir