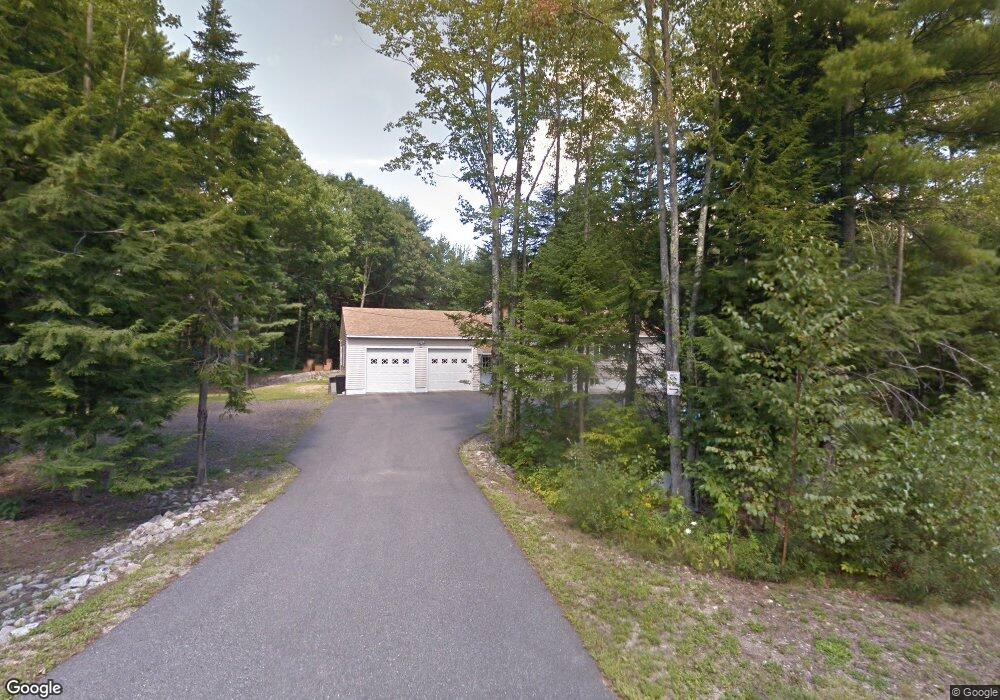
17 Chretien Rd Biddeford, ME 04005
South Biddeford NeighborhoodEstimated Value: $448,000 - $531,000
2
Beds
2
Baths
1,188
Sq Ft
$418/Sq Ft
Est. Value
About This Home
This home is located at 17 Chretien Rd, Biddeford, ME 04005 and is currently estimated at $496,153, approximately $417 per square foot. 17 Chretien Rd is a home located in York County with nearby schools including John F Kennedy Memorial School, Biddeford Primary School, and Biddeford Intermediate School.
Ownership History
Date
Name
Owned For
Owner Type
Purchase Details
Closed on
Sep 25, 2009
Sold by
Chretien James F
Bought by
Moscrip Darren D
Current Estimated Value
Home Financials for this Owner
Home Financials are based on the most recent Mortgage that was taken out on this home.
Original Mortgage
$183,673
Outstanding Balance
$121,336
Interest Rate
5.31%
Mortgage Type
FHA
Estimated Equity
$374,817
Create a Home Valuation Report for This Property
The Home Valuation Report is an in-depth analysis detailing your home's value as well as a comparison with similar homes in the area
Home Values in the Area
Average Home Value in this Area
Purchase History
| Date | Buyer | Sale Price | Title Company |
|---|---|---|---|
| Moscrip Darren D | -- | -- |
Source: Public Records
Mortgage History
| Date | Status | Borrower | Loan Amount |
|---|---|---|---|
| Open | Moscrip Darren D | $183,673 |
Source: Public Records
Tax History Compared to Growth
Tax History
| Year | Tax Paid | Tax Assessment Tax Assessment Total Assessment is a certain percentage of the fair market value that is determined by local assessors to be the total taxable value of land and additions on the property. | Land | Improvement |
|---|---|---|---|---|
| 2024 | $5,561 | $391,100 | $158,900 | $232,200 |
| 2023 | $5,131 | $391,100 | $158,900 | $232,200 |
| 2022 | $5,031 | $306,600 | $104,100 | $202,500 |
| 2021 | $4,762 | $261,200 | $86,600 | $174,600 |
| 2020 | $4,660 | $232,400 | $70,900 | $161,500 |
| 2019 | $4,643 | $232,400 | $70,900 | $161,500 |
| 2018 | $4,578 | $232,400 | $70,900 | $161,500 |
| 2017 | $4,271 | $212,800 | $70,900 | $141,900 |
| 2016 | $4,226 | $212,800 | $70,900 | $141,900 |
| 2015 | $3,949 | $212,800 | $70,900 | $141,900 |
| 2014 | $3,669 | $203,200 | $70,900 | $132,300 |
| 2013 | -- | $218,800 | $66,600 | $152,200 |
Source: Public Records
Map
Nearby Homes