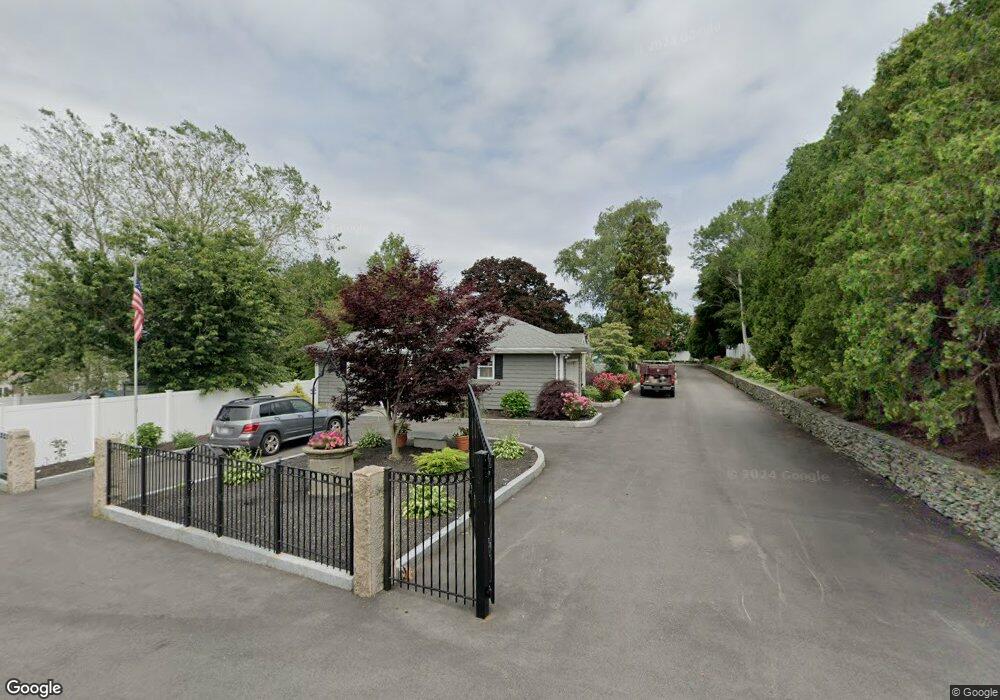
17 Christopher Dr Westport, MA 02790
North Westport NeighborhoodEstimated Value: $496,000 - $600,000
3
Beds
--
Bath
1,590
Sq Ft
$341/Sq Ft
Est. Value
About This Home
This home is located at 17 Christopher Dr, Westport, MA 02790 and is currently estimated at $542,451, approximately $341 per square foot. 17 Christopher Dr is a home located in Bristol County with nearby schools including Alice A. Macomber Primary School, Westport Elementary School, and Westport Middle-High School.
Ownership History
Date
Name
Owned For
Owner Type
Purchase Details
Closed on
Sep 30, 2016
Sold by
Saulnier Zachary J
Bought by
Vasconcellos Maria C and Vasconcellos Jose M
Current Estimated Value
Purchase Details
Closed on
Jun 11, 1997
Sold by
Bastille Florilda M
Bought by
Saulnier Zachary J
Home Financials for this Owner
Home Financials are based on the most recent Mortgage that was taken out on this home.
Original Mortgage
$50,000
Interest Rate
7.97%
Mortgage Type
Purchase Money Mortgage
Create a Home Valuation Report for This Property
The Home Valuation Report is an in-depth analysis detailing your home's value as well as a comparison with similar homes in the area
Home Values in the Area
Average Home Value in this Area
Purchase History
| Date | Buyer | Sale Price | Title Company |
|---|---|---|---|
| Vasconcellos Maria C | $200,000 | -- | |
| Saulnier Zachary J | $125,000 | -- |
Source: Public Records
Mortgage History
| Date | Status | Borrower | Loan Amount |
|---|---|---|---|
| Previous Owner | Saulnier Zachary J | $37,500 | |
| Previous Owner | Saulnier Zachary J | $50,000 |
Source: Public Records
Tax History Compared to Growth
Tax History
| Year | Tax Paid | Tax Assessment Tax Assessment Total Assessment is a certain percentage of the fair market value that is determined by local assessors to be the total taxable value of land and additions on the property. | Land | Improvement |
|---|---|---|---|---|
| 2025 | $3,729 | $500,600 | $186,600 | $314,000 |
| 2024 | $3,731 | $482,700 | $172,900 | $309,800 |
| 2023 | $3,480 | $426,500 | $145,700 | $280,800 |
| 2022 | $2,711 | $319,700 | $139,300 | $180,400 |
| 2021 | $2,647 | $307,100 | $126,700 | $180,400 |
| 2020 | $2,452 | $290,900 | $116,100 | $174,800 |
| 2019 | $2,381 | $287,900 | $116,100 | $171,800 |
| 2018 | $1,873 | $229,200 | $118,800 | $110,400 |
| 2017 | $1,983 | $248,800 | $118,800 | $130,000 |
| 2016 | $1,874 | $236,900 | $118,800 | $118,100 |
| 2015 | $1,778 | $224,200 | $118,800 | $105,400 |
Source: Public Records
Map
Nearby Homes
- 33 William St
- 25 Beaulieu St
- 6 Beaulieu St
- 128 Old Bedford Rd
- 9 Register Ave
- 34 Alsop St
- 125 Angell St
- 92 Benoit St
- 3 Diane Way
- 37 Eaton St
- 1792 Pleasant St Unit 1808
- 219 Earle St Unit 3
- 217 Earle St Unit 2
- 215 Earle St Unit 1
- 85 Reney St
- 172 Earle St
- 951 Dickinson St
- 89 Lafayette St
- 4 Lake Ave
- 383 Alden St