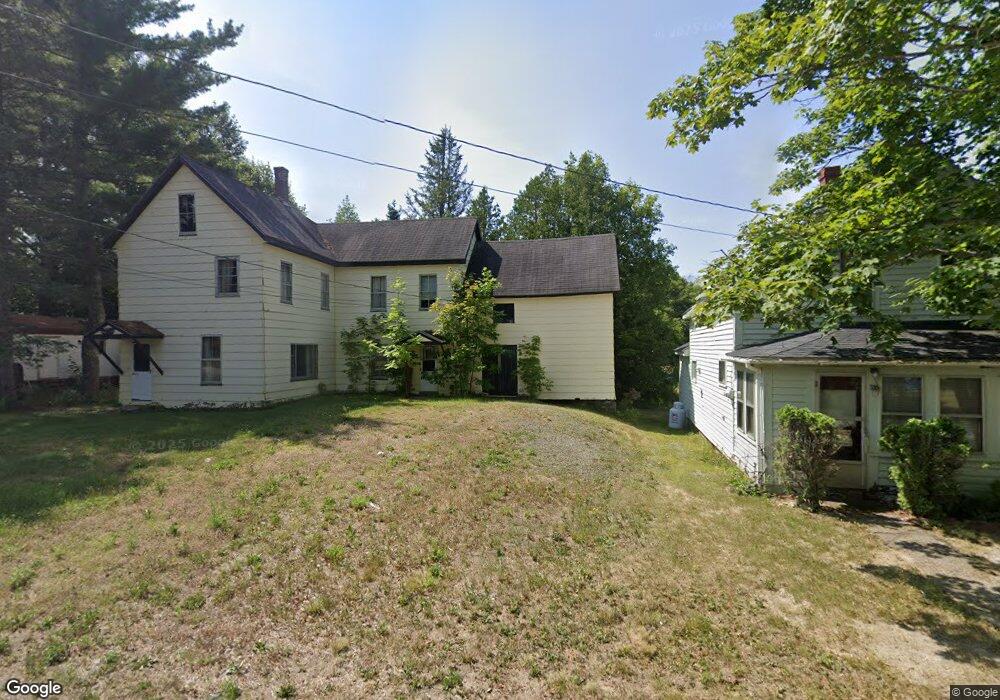
17 Clark St Calais, ME 04619
Estimated Value: $207,000 - $239,000
3
Beds
1
Bath
642
Sq Ft
$345/Sq Ft
Est. Value
About This Home
This home is located at 17 Clark St, Calais, ME 04619 and is currently estimated at $221,180, approximately $344 per square foot. 17 Clark St is a home with nearby schools including Calais Elementary School and Calais Middle/High School.
Ownership History
Date
Name
Owned For
Owner Type
Purchase Details
Closed on
Feb 28, 2025
Sold by
Maclauchlan Glenn A
Bought by
Sparks William W and Stoddard Mary B
Current Estimated Value
Home Financials for this Owner
Home Financials are based on the most recent Mortgage that was taken out on this home.
Original Mortgage
$176,000
Outstanding Balance
$175,129
Interest Rate
7.04%
Mortgage Type
Purchase Money Mortgage
Estimated Equity
$46,051
Create a Home Valuation Report for This Property
The Home Valuation Report is an in-depth analysis detailing your home's value as well as a comparison with similar homes in the area
Home Values in the Area
Average Home Value in this Area
Purchase History
| Date | Buyer | Sale Price | Title Company |
|---|---|---|---|
| Sparks William W | $220,000 | None Available | |
| Sparks William W | $220,000 | None Available |
Source: Public Records
Mortgage History
| Date | Status | Borrower | Loan Amount |
|---|---|---|---|
| Open | Sparks William W | $176,000 | |
| Closed | Sparks William W | $176,000 |
Source: Public Records
Tax History Compared to Growth
Tax History
| Year | Tax Paid | Tax Assessment Tax Assessment Total Assessment is a certain percentage of the fair market value that is determined by local assessors to be the total taxable value of land and additions on the property. | Land | Improvement |
|---|---|---|---|---|
| 2024 | $2,151 | $143,400 | $20,600 | $122,800 |
| 2023 | $2,101 | $123,600 | $17,700 | $105,900 |
| 2022 | $1,898 | $99,900 | $14,300 | $85,600 |
| 2021 | $2,069 | $95,800 | $13,700 | $82,100 |
| 2020 | $2,070 | $81,800 | $11,700 | $70,100 |
| 2019 | $2,070 | $81,800 | $11,700 | $70,100 |
| 2018 | $2,070 | $81,800 | $11,700 | $70,100 |
| 2017 | $2,070 | $81,800 | $11,700 | $70,100 |
| 2016 | $2,070 | $81,800 | $11,700 | $70,100 |
| 2015 | $2,070 | $81,800 | $11,700 | $70,100 |
| 2014 | $2,070 | $81,800 | $11,700 | $70,100 |
| 2013 | $2,070 | $81,800 | $11,700 | $70,100 |
Source: Public Records
Map
Nearby Homes
- 43 Harrison St
- 445 South St
- 71-75 Baring St
- 332 North St
- P/O Lot 6 Higgins Farm Rd
- Lot 5 Higgins Farm Rd
- Lot 4 Higgins Farm Rd
- 33 Pleasant St
- M5B7L8 Pleasant St
- 24 Todd St
- 100 Barker St
- 69 Lafayette St
- 37 Price St
- 34 Price St
- 1 Downes St
- 48 Germain St
- 89 Washington St
- 158 South St
- 35 Germain St
- 79 North St