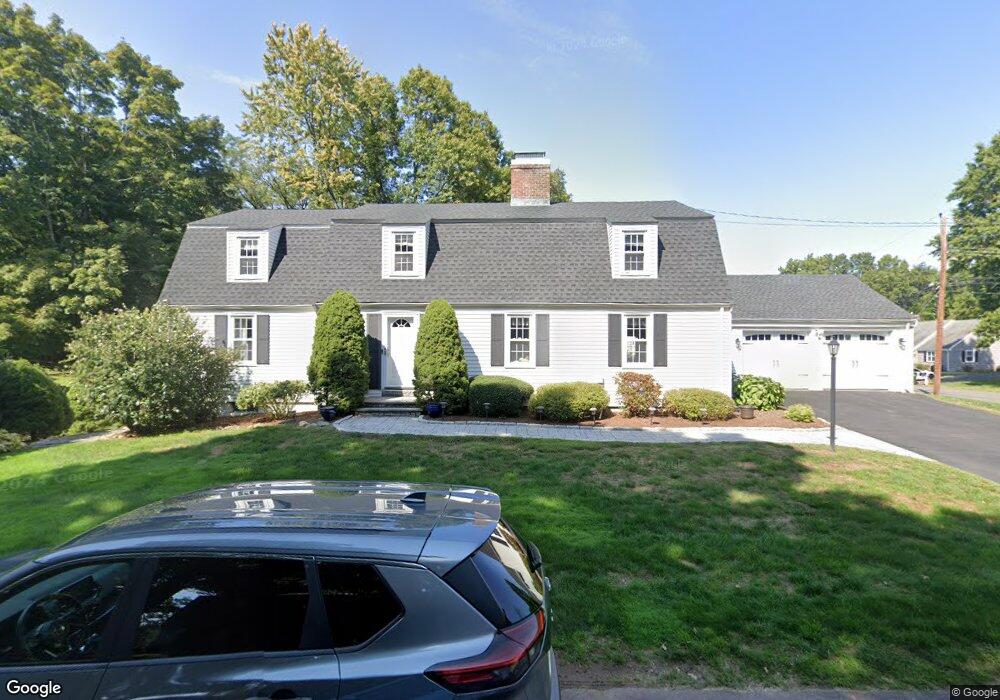
17 Claybar Dr West Hartford, CT 06117
Estimated Value: $871,436 - $1,035,000
5
Beds
4
Baths
3,341
Sq Ft
$288/Sq Ft
Est. Value
About This Home
This home is located at 17 Claybar Dr, West Hartford, CT 06117 and is currently estimated at $962,859, approximately $288 per square foot. 17 Claybar Dr is a home located in Hartford County with nearby schools including Bugbee School, King Philip Middle School, and Hall High School.
Ownership History
Date
Name
Owned For
Owner Type
Purchase Details
Closed on
Jul 1, 2010
Sold by
Resony Marion W
Bought by
Debin Adam M and Debin Stacey R
Current Estimated Value
Home Financials for this Owner
Home Financials are based on the most recent Mortgage that was taken out on this home.
Original Mortgage
$475,500
Outstanding Balance
$318,493
Interest Rate
4.88%
Estimated Equity
$644,366
Create a Home Valuation Report for This Property
The Home Valuation Report is an in-depth analysis detailing your home's value as well as a comparison with similar homes in the area
Home Values in the Area
Average Home Value in this Area
Purchase History
| Date | Buyer | Sale Price | Title Company |
|---|---|---|---|
| Debin Adam M | $495,000 | -- |
Source: Public Records
Mortgage History
| Date | Status | Borrower | Loan Amount |
|---|---|---|---|
| Open | Debin Adam M | $475,500 |
Source: Public Records
Tax History Compared to Growth
Tax History
| Year | Tax Paid | Tax Assessment Tax Assessment Total Assessment is a certain percentage of the fair market value that is determined by local assessors to be the total taxable value of land and additions on the property. | Land | Improvement |
|---|---|---|---|---|
| 2025 | $19,416 | $433,580 | $118,720 | $314,860 |
| 2024 | $18,362 | $433,580 | $118,720 | $314,860 |
| 2023 | $17,742 | $433,580 | $118,720 | $314,860 |
| 2022 | $17,638 | $433,580 | $118,720 | $314,860 |
| 2021 | $17,255 | $406,770 | $125,020 | $281,750 |
| 2020 | $16,848 | $403,060 | $116,550 | $286,510 |
| 2019 | $16,745 | $400,610 | $116,550 | $284,060 |
| 2018 | $16,425 | $400,610 | $116,550 | $284,060 |
| 2017 | $16,398 | $399,560 | $115,500 | $284,060 |
| 2016 | $13,104 | $331,660 | $89,250 | $242,410 |
| 2015 | $12,706 | $331,660 | $89,250 | $242,410 |
| 2014 | $12,394 | $331,660 | $89,250 | $242,410 |
Source: Public Records
Map
Nearby Homes
- 26 Berwyn Rd
- 56 Fox Chase Ln
- 37 W Normandy Dr
- 47 Hillsboro Dr
- 16 Morningcrest Dr
- 124 High Ridge Rd
- 592 Mountain Rd Unit A
- 41 Soby Dr
- 15 Rushleigh Rd
- 170 Hunter Dr
- 21 Rushleigh Rd
- 269 Mountain Rd
- 186 Hunter Dr
- 47 Flagg Rd
- 62 Blue Ridge Ln
- 2581 Albany Ave
- 132 N Main St
- 11 Rye Ridge Pkwy
- 50 Magnolia Hill
- 183 Loomis Dr Unit 109