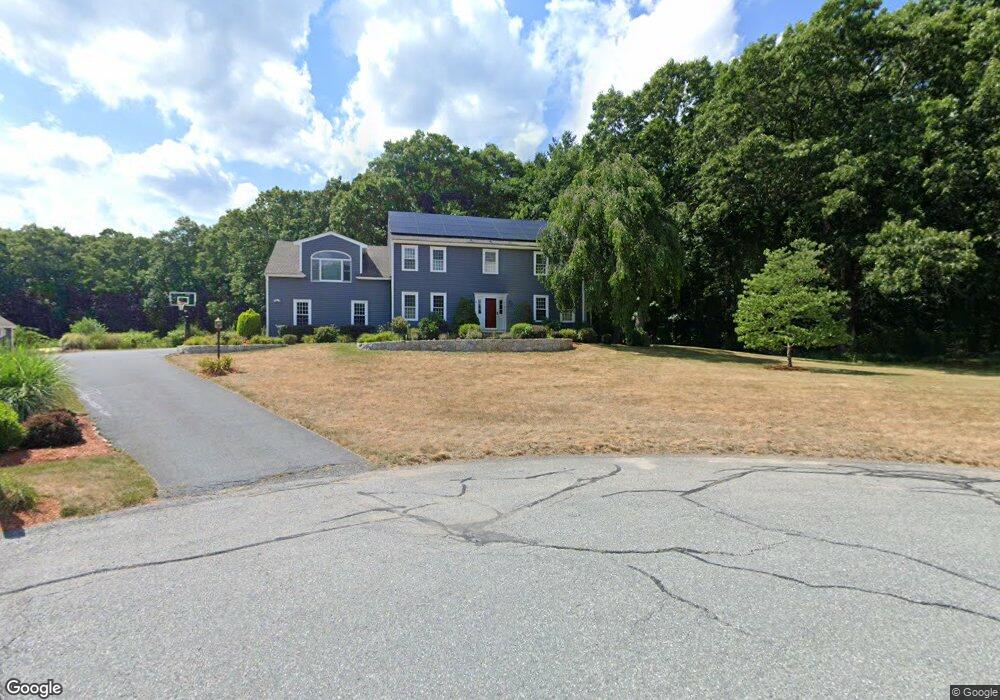
17 Colella Farm Rd Hopkinton, MA 01748
Estimated Value: $1,147,000 - $1,246,000
4
Beds
3
Baths
2,828
Sq Ft
$421/Sq Ft
Est. Value
About This Home
This home is located at 17 Colella Farm Rd, Hopkinton, MA 01748 and is currently estimated at $1,189,866, approximately $420 per square foot. 17 Colella Farm Rd is a home located in Middlesex County with nearby schools including Marathon Elementary School, Hopkins Elementary School, and Elmwood Elementary School.
Ownership History
Date
Name
Owned For
Owner Type
Purchase Details
Closed on
Jun 11, 2015
Sold by
Cunningham Brian P and Cunningham Judith D
Bought by
Jana Ravi and Jana Indira K
Current Estimated Value
Home Financials for this Owner
Home Financials are based on the most recent Mortgage that was taken out on this home.
Original Mortgage
$500,000
Outstanding Balance
$385,876
Interest Rate
3.65%
Mortgage Type
New Conventional
Estimated Equity
$803,990
Purchase Details
Closed on
Nov 27, 2002
Sold by
Kelly Kel and Mcgovern Kelly A
Bought by
Cunningham Brian P and Cunningham Judith D
Home Financials for this Owner
Home Financials are based on the most recent Mortgage that was taken out on this home.
Original Mortgage
$195,000
Interest Rate
6.16%
Mortgage Type
Purchase Money Mortgage
Purchase Details
Closed on
Sep 19, 1994
Sold by
Charlesview 7 Dev
Bought by
Mcgovern Kelly A
Create a Home Valuation Report for This Property
The Home Valuation Report is an in-depth analysis detailing your home's value as well as a comparison with similar homes in the area
Home Values in the Area
Average Home Value in this Area
Purchase History
| Date | Buyer | Sale Price | Title Company |
|---|---|---|---|
| Jana Ravi | $625,000 | -- | |
| Cunningham Brian P | $562,500 | -- | |
| Mcgovern Kelly A | $254,500 | -- |
Source: Public Records
Mortgage History
| Date | Status | Borrower | Loan Amount |
|---|---|---|---|
| Open | Jana Ravi | $500,000 | |
| Previous Owner | Cunningham Brian P | $195,000 | |
| Previous Owner | Mcgovern Kelly A | $222,000 | |
| Previous Owner | Mcgovern Kelly A | $160,000 | |
| Previous Owner | Mcgovern Kelly A | $33,000 |
Source: Public Records
Tax History Compared to Growth
Tax History
| Year | Tax Paid | Tax Assessment Tax Assessment Total Assessment is a certain percentage of the fair market value that is determined by local assessors to be the total taxable value of land and additions on the property. | Land | Improvement |
|---|---|---|---|---|
| 2025 | $14,313 | $1,009,400 | $377,200 | $632,200 |
| 2024 | $12,756 | $873,100 | $359,100 | $514,000 |
| 2023 | $12,329 | $779,800 | $295,200 | $484,600 |
| 2022 | $12,117 | $711,500 | $268,600 | $442,900 |
| 2021 | $11,782 | $689,800 | $260,700 | $429,100 |
| 2020 | $11,273 | $670,200 | $254,500 | $415,700 |
| 2019 | $11,421 | $665,200 | $249,800 | $415,400 |
| 2018 | $10,848 | $641,900 | $238,000 | $403,900 |
| 2017 | $10,493 | $624,600 | $231,100 | $393,500 |
| 2016 | $10,364 | $608,600 | $226,600 | $382,000 |
| 2015 | -- | $575,500 | $220,000 | $355,500 |
Source: Public Records
Map
Nearby Homes
- 4 Angelo Dr
- 40 Sanctuary Ln
- 15 Chamberlain St
- 11 Myrtle Ave Unit 5
- 16 Fitch Ave Unit 6
- 14 Fitch Ave Unit 7
- 12 Fitch Ave Unit 8
- 10 Fitch Ave Unit 9
- 13 Fitch Ave
- 13 Fitch Ave Unit 19
- 11 Fitch Ave Unit 18
- Stockbridge Plan at Newbury Glen
- Williamstown Plan at Newbury Glen
- Silverbrook Plan at Newbury Glen
- Dickinson Plan at Newbury Glen
- Copley Plan at Newbury Glen
- 7 Myrtle Ave Unit 3
- 211 Hayden Rowe St
- 4 Myrtle Ave Unit 20
- 5 Myrtle Ave Unit 2
- 15 Colella Farm Rd
- 20 Colella Farm Rd
- 13 Colella Farm Rd
- 16 Nicholas Rd
- 6 Angelo Dr
- 14 Nicholas Rd
- 18 Nicholas Rd
- 18 Colella Farm Rd
- 33 Chamberlain St
- 20 Nicholas Rd
- 12 Nicholas Rd
- 29 Chamberlain St
- 11 Colella Farm Rd
- 22 Nicholas Rd
- 31 Chamberlain St
- 27 Chamberlain St
- 10 Nicholas Rd
- 0 Lot 76 Colella Farm Rd Unit 50484183
- 11 Nicholas Rd
- 13 Nicholas Rd