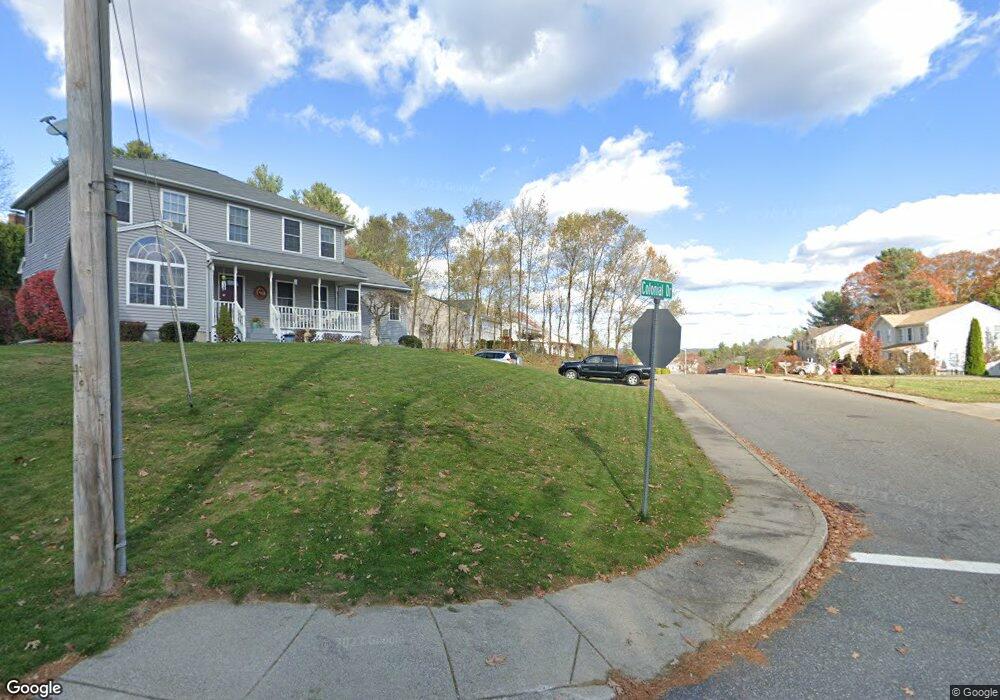
17 Colonial Dr Southbridge, MA 01550
Estimated Value: $423,000 - $523,000
3
Beds
3
Baths
2,226
Sq Ft
$209/Sq Ft
Est. Value
About This Home
This home is located at 17 Colonial Dr, Southbridge, MA 01550 and is currently estimated at $466,271, approximately $209 per square foot. 17 Colonial Dr is a home located in Worcester County with nearby schools including Trinity Catholic Academy and ViewPoint Christian Academy.
Ownership History
Date
Name
Owned For
Owner Type
Purchase Details
Closed on
Aug 31, 2005
Sold by
Savoie Sandra A
Bought by
Gallagher Frank A
Current Estimated Value
Home Financials for this Owner
Home Financials are based on the most recent Mortgage that was taken out on this home.
Original Mortgage
$224,900
Outstanding Balance
$118,536
Interest Rate
5.81%
Mortgage Type
Purchase Money Mortgage
Estimated Equity
$347,735
Purchase Details
Closed on
Jul 29, 1996
Sold by
Konstantakis Christo and Konstantakis Irene
Bought by
Savoie Wilfred and Savoie Sandra
Create a Home Valuation Report for This Property
The Home Valuation Report is an in-depth analysis detailing your home's value as well as a comparison with similar homes in the area
Home Values in the Area
Average Home Value in this Area
Purchase History
| Date | Buyer | Sale Price | Title Company |
|---|---|---|---|
| Gallagher Frank A | $264,900 | -- | |
| Gallagher Frank A | $264,900 | -- | |
| Savoie Wilfred | $121,785 | -- | |
| Savoie Wilfred | $121,785 | -- |
Source: Public Records
Mortgage History
| Date | Status | Borrower | Loan Amount |
|---|---|---|---|
| Open | Gallagher Frank A | $224,900 | |
| Closed | Savoie Wilfred | $224,900 | |
| Previous Owner | Savoie Wilfred | $25,000 | |
| Previous Owner | Savoie Wilfred | $97,000 |
Source: Public Records
Tax History Compared to Growth
Tax History
| Year | Tax Paid | Tax Assessment Tax Assessment Total Assessment is a certain percentage of the fair market value that is determined by local assessors to be the total taxable value of land and additions on the property. | Land | Improvement |
|---|---|---|---|---|
| 2025 | $5,427 | $370,200 | $40,600 | $329,600 |
| 2024 | $5,712 | $374,300 | $33,800 | $340,500 |
| 2023 | $5,642 | $356,200 | $33,800 | $322,400 |
| 2022 | $5,685 | $317,600 | $28,900 | $288,700 |
| 2021 | $5,017 | $258,100 | $28,900 | $229,200 |
| 2020 | $4,796 | $246,200 | $28,900 | $217,300 |
| 2018 | $4,077 | $196,500 | $28,900 | $167,600 |
| 2017 | $4,217 | $205,000 | $28,900 | $176,100 |
| 2016 | $4,119 | $203,800 | $33,300 | $170,500 |
| 2015 | $4,149 | $203,800 | $33,300 | $170,500 |
| 2014 | $3,891 | $198,100 | $33,300 | $164,800 |
Source: Public Records
Map
Nearby Homes