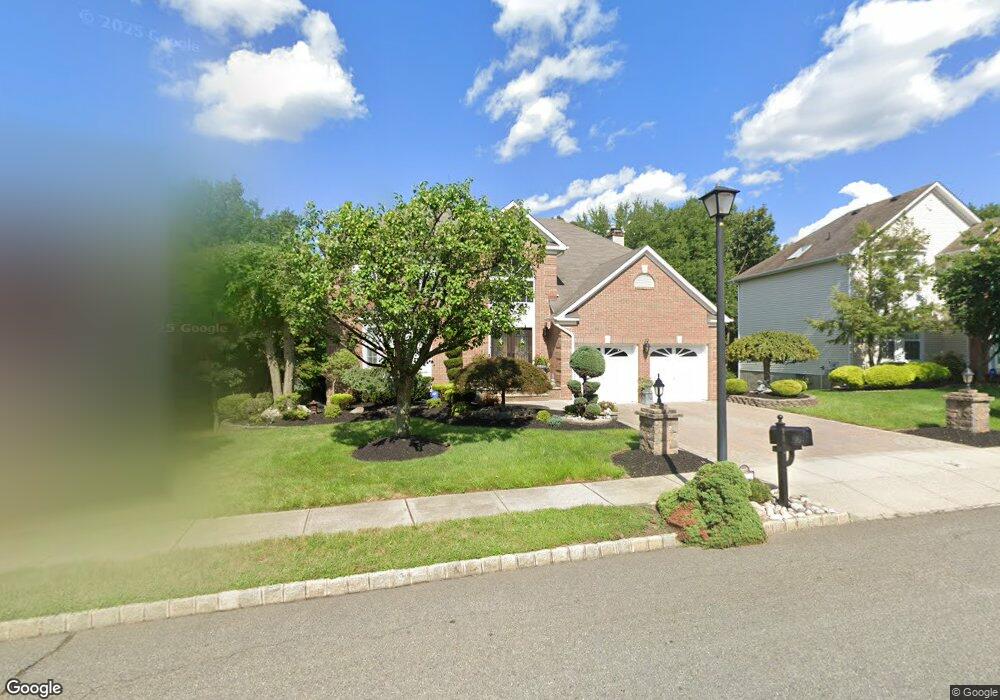
17 Continental Ct South River, NJ 08882
Estimated Value: $803,757 - $902,000
--
Bed
--
Bath
2,401
Sq Ft
$353/Sq Ft
Est. Value
About This Home
This home is located at 17 Continental Ct, South River, NJ 08882 and is currently estimated at $847,189, approximately $352 per square foot. 17 Continental Ct is a home located in Middlesex County with nearby schools including South River Primary School, South River Elementary School, and South River Middle School.
Ownership History
Date
Name
Owned For
Owner Type
Purchase Details
Closed on
Feb 19, 2003
Sold by
Wilde Timothy
Bought by
Campetella Paul
Current Estimated Value
Home Financials for this Owner
Home Financials are based on the most recent Mortgage that was taken out on this home.
Original Mortgage
$257,250
Outstanding Balance
$110,415
Interest Rate
5.98%
Estimated Equity
$736,774
Purchase Details
Closed on
Sep 27, 1999
Sold by
Cirello Marc
Bought by
Wilde Timothy and Wilde Dana
Home Financials for this Owner
Home Financials are based on the most recent Mortgage that was taken out on this home.
Original Mortgage
$263,500
Interest Rate
7.83%
Purchase Details
Closed on
Oct 30, 1995
Sold by
Matzel & Mumford At So River
Bought by
Cirello Marc and Ficano Maria
Home Financials for this Owner
Home Financials are based on the most recent Mortgage that was taken out on this home.
Original Mortgage
$235,000
Interest Rate
7.53%
Create a Home Valuation Report for This Property
The Home Valuation Report is an in-depth analysis detailing your home's value as well as a comparison with similar homes in the area
Home Values in the Area
Average Home Value in this Area
Purchase History
| Date | Buyer | Sale Price | Title Company |
|---|---|---|---|
| Campetella Paul | $457,250 | -- | |
| -- | $457,300 | -- | |
| Wilde Timothy | $283,500 | -- | |
| Cirello Marc | $249,000 | -- |
Source: Public Records
Mortgage History
| Date | Status | Borrower | Loan Amount |
|---|---|---|---|
| Open | -- | $257,250 | |
| Previous Owner | Wilde Timothy | $263,500 | |
| Previous Owner | Cirello Marc | $235,000 |
Source: Public Records
Tax History Compared to Growth
Tax History
| Year | Tax Paid | Tax Assessment Tax Assessment Total Assessment is a certain percentage of the fair market value that is determined by local assessors to be the total taxable value of land and additions on the property. | Land | Improvement |
|---|---|---|---|---|
| 2025 | $12,208 | $479,300 | $163,900 | $315,400 |
| 2024 | $11,844 | $479,300 | $163,900 | $315,400 |
| 2023 | $11,844 | $479,300 | $163,900 | $315,400 |
| 2022 | $11,637 | $479,300 | $163,900 | $315,400 |
| 2021 | $8,341 | $479,300 | $163,900 | $315,400 |
| 2020 | $10,962 | $479,300 | $163,900 | $315,400 |
| 2019 | $11,449 | $139,000 | $23,600 | $115,400 |
| 2018 | $11,174 | $139,000 | $23,600 | $115,400 |
| 2017 | $10,766 | $139,000 | $23,600 | $115,400 |
| 2016 | $10,358 | $139,000 | $23,600 | $115,400 |
| 2015 | $10,126 | $139,000 | $23,600 | $115,400 |
| 2014 | $9,894 | $139,000 | $23,600 | $115,400 |
Source: Public Records
Map
Nearby Homes
- 19 Continental Ct
- 15 Continental Ct
- 21 Continental Ct
- 13 Continental Ct
- 18 Continental Ct
- 16 Continental Ct
- 20 Continental Ct
- 14 Continental Ct
- 23 Continental Ct
- 11 Continental Ct
- 22 Continental Ct
- 144 Leonardine Ave
- 25 Continental Ct
- 25 Heritage Dr
- 24 Continental Ct
- 35 Heritage Dr
- 10 Continental Ct
- 37 Heritage Dr
- 39 Heritage Dr
- 23 Heritage Dr