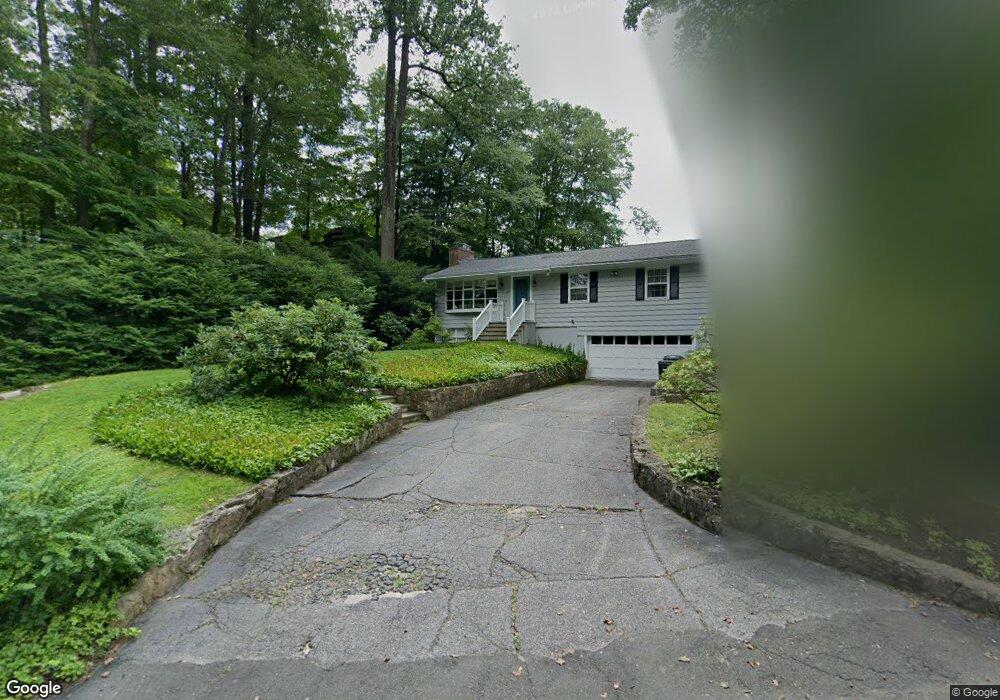
17 Craigmoor Rd S Ridgefield, CT 06877
Estimated Value: $813,398 - $886,000
3
Beds
2
Baths
1,817
Sq Ft
$473/Sq Ft
Est. Value
About This Home
This home is located at 17 Craigmoor Rd S, Ridgefield, CT 06877 and is currently estimated at $860,100, approximately $473 per square foot. 17 Craigmoor Rd S is a home located in Fairfield County with nearby schools including Barlow Mountain Elementary School, Scotts Ridge Middle School, and Ridgefield High School.
Ownership History
Date
Name
Owned For
Owner Type
Purchase Details
Closed on
Oct 31, 2011
Sold by
Neale Claudia Francoi
Bought by
Brefka Cornella A
Current Estimated Value
Home Financials for this Owner
Home Financials are based on the most recent Mortgage that was taken out on this home.
Original Mortgage
$300,000
Outstanding Balance
$205,458
Interest Rate
4.11%
Estimated Equity
$654,642
Purchase Details
Closed on
Feb 27, 1997
Sold by
Echevarria Juan Carlos and Moran Victoria M
Bought by
Neale Claudia G
Home Financials for this Owner
Home Financials are based on the most recent Mortgage that was taken out on this home.
Original Mortgage
$150,000
Interest Rate
7.78%
Mortgage Type
Unknown
Purchase Details
Closed on
Oct 20, 1992
Sold by
Hubert Ralph and Hubert Frances
Bought by
Echevarria Juan and Moran Victoria
Home Financials for this Owner
Home Financials are based on the most recent Mortgage that was taken out on this home.
Original Mortgage
$100,000
Interest Rate
4.5%
Mortgage Type
Unknown
Create a Home Valuation Report for This Property
The Home Valuation Report is an in-depth analysis detailing your home's value as well as a comparison with similar homes in the area
Home Values in the Area
Average Home Value in this Area
Purchase History
| Date | Buyer | Sale Price | Title Company |
|---|---|---|---|
| Brefka Cornella A | $487,500 | -- | |
| Neale Claudia G | $280,000 | -- | |
| Echevarria Juan | $300,000 | -- |
Source: Public Records
Mortgage History
| Date | Status | Borrower | Loan Amount |
|---|---|---|---|
| Open | Echevarria Juan | $300,000 | |
| Previous Owner | Echevarria Juan | $164,500 | |
| Previous Owner | Echevarria Juan | $150,000 | |
| Previous Owner | Echevarria Juan | $100,000 |
Source: Public Records
Tax History Compared to Growth
Tax History
| Year | Tax Paid | Tax Assessment Tax Assessment Total Assessment is a certain percentage of the fair market value that is determined by local assessors to be the total taxable value of land and additions on the property. | Land | Improvement |
|---|---|---|---|---|
| 2025 | $11,479 | $419,090 | $319,200 | $99,890 |
| 2024 | $11,043 | $419,090 | $319,200 | $99,890 |
| 2023 | $10,817 | $419,090 | $319,200 | $99,890 |
| 2022 | $8,812 | $309,960 | $212,800 | $97,160 |
| 2021 | $8,744 | $309,960 | $212,800 | $97,160 |
| 2020 | $8,716 | $309,960 | $212,800 | $97,160 |
| 2019 | $8,716 | $309,960 | $212,800 | $97,160 |
| 2018 | $8,611 | $309,960 | $212,800 | $97,160 |
| 2017 | $8,470 | $311,300 | $210,680 | $100,620 |
| 2016 | $8,309 | $311,300 | $210,680 | $100,620 |
| 2015 | $8,097 | $311,300 | $210,680 | $100,620 |
| 2014 | $8,097 | $311,300 | $210,680 | $100,620 |
Source: Public Records
Map
Nearby Homes
- 23 Pond Rd
- 213 Mamanasco Rd
- 10 Hillcrest Ct
- 463 N Salem Rd
- 803 N Salem Rd
- 415 Barrack Hill Rd
- 121 Sleepy Hollow Rd
- 86 Round Lake Rd
- 550 Barrack Hill Rd
- 88 Green Ln
- 358 N Salem Rd
- 873 N Salem Rd
- 83 Aspen Ledges Rd
- 68 Mopus Bridge Rd
- 261 North St
- 85 Spring Valley Rd
- 34 Highview Dr
- 22 Ketcham Rd
- 6 Whitlock Ln
- 31 Ridgecrest Dr