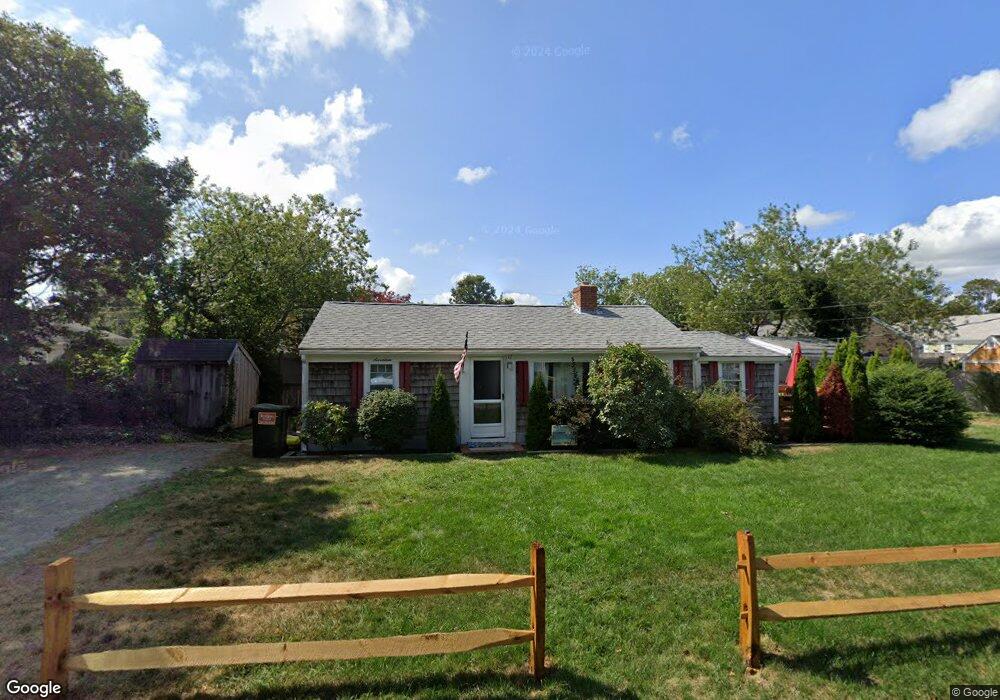
17 Cranberry Ln Dennis Port, MA 02639
Dennis Port NeighborhoodEstimated Value: $384,000 - $529,686
3
Beds
1
Bath
800
Sq Ft
$565/Sq Ft
Est. Value
About This Home
This home is located at 17 Cranberry Ln, Dennis Port, MA 02639 and is currently estimated at $451,672, approximately $564 per square foot. 17 Cranberry Ln is a home located in Barnstable County with nearby schools including Dennis-Yarmouth Regional High School and St. Pius X. School.
Ownership History
Date
Name
Owned For
Owner Type
Purchase Details
Closed on
Jul 21, 1995
Sold by
Prestileo James M and Prestileo Barbara J
Bought by
Paquin Scott M and Paquin Mark P
Current Estimated Value
Home Financials for this Owner
Home Financials are based on the most recent Mortgage that was taken out on this home.
Original Mortgage
$44,800
Interest Rate
7.49%
Mortgage Type
Purchase Money Mortgage
Create a Home Valuation Report for This Property
The Home Valuation Report is an in-depth analysis detailing your home's value as well as a comparison with similar homes in the area
Home Values in the Area
Average Home Value in this Area
Purchase History
| Date | Buyer | Sale Price | Title Company |
|---|---|---|---|
| Paquin Scott M | $56,000 | -- |
Source: Public Records
Mortgage History
| Date | Status | Borrower | Loan Amount |
|---|---|---|---|
| Open | Paquin Scott M | $147,900 | |
| Closed | Paquin Scott M | $60,000 | |
| Closed | Paquin Scott M | $44,800 |
Source: Public Records
Tax History Compared to Growth
Tax History
| Year | Tax Paid | Tax Assessment Tax Assessment Total Assessment is a certain percentage of the fair market value that is determined by local assessors to be the total taxable value of land and additions on the property. | Land | Improvement |
|---|---|---|---|---|
| 2025 | $1,759 | $406,300 | $195,300 | $211,000 |
| 2024 | $1,627 | $370,700 | $187,800 | $182,900 |
| 2023 | $1,574 | $337,100 | $170,700 | $166,400 |
| 2022 | $1,544 | $275,800 | $153,800 | $122,000 |
| 2021 | $0 | $271,800 | $172,300 | $99,500 |
| 2020 | $1,470 | $241,000 | $150,800 | $90,200 |
| 2019 | $1,406 | $227,900 | $147,800 | $80,100 |
| 2018 | $1,361 | $214,700 | $140,700 | $74,000 |
| 2017 | $1,269 | $206,400 | $130,700 | $75,700 |
| 2016 | $1,332 | $204,000 | $140,700 | $63,300 |
| 2015 | $1,306 | $204,000 | $140,700 | $63,300 |
| 2014 | $1,168 | $183,900 | $120,600 | $63,300 |
Source: Public Records
Map
Nearby Homes
- 31 Easy St
- 22 Wixon Rd
- 22 Ferncliff Rd
- 19 Standish Way
- 72 Bassett Ln
- 37 Beach Hills Rd
- 37-A Beach Hills Rd
- 80 Michaels Ave
- 262 Old Wharf Rd Unit 67
- 262 Old Wharf Rd Unit 5
- 262 Old Wharf Rd Unit 5
- 262 Old Wharf Rd Unit 20
- 262 Old Wharf Rd Unit 87
- 102 Sea St
- 4 Coffey Ln
- 268 Main St
- 125 Main St Unit 3
- 241 Old Wharf Rd Unit 82
- 241 Old Wharf Rd Unit 127
- 241 Old Wharf Rd Unit 90