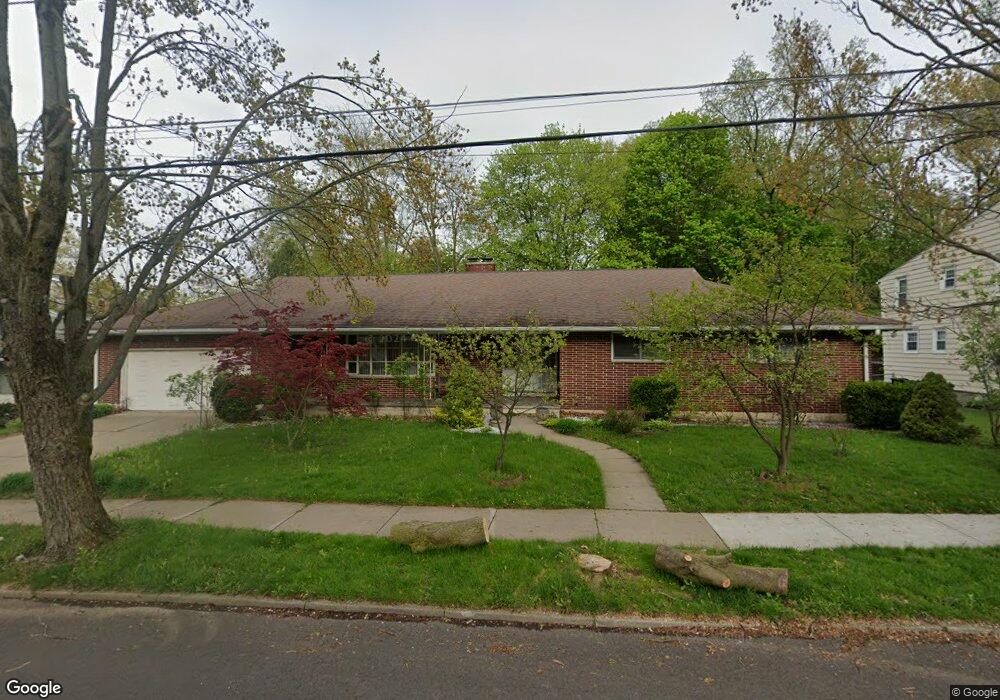
17 Crary Ave Binghamton, NY 13905
Far West Side NeighborhoodEstimated Value: $262,795 - $302,000
2
Beds
2
Baths
1,730
Sq Ft
$161/Sq Ft
Est. Value
About This Home
This home is located at 17 Crary Ave, Binghamton, NY 13905 and is currently estimated at $277,699, approximately $160 per square foot. 17 Crary Ave is a home located in Broome County with nearby schools including Binghamton High School, Thomas Jefferson Elementary School, and West Middle School.
Ownership History
Date
Name
Owned For
Owner Type
Purchase Details
Closed on
Aug 18, 2000
Sold by
Perhach Michael M
Bought by
Stefos Mary E
Current Estimated Value
Purchase Details
Closed on
Nov 18, 1997
Create a Home Valuation Report for This Property
The Home Valuation Report is an in-depth analysis detailing your home's value as well as a comparison with similar homes in the area
Home Values in the Area
Average Home Value in this Area
Purchase History
| Date | Buyer | Sale Price | Title Company |
|---|---|---|---|
| Stefos Mary E | $130,000 | Ronald L Greene | |
| -- | $71,819 | -- |
Source: Public Records
Tax History Compared to Growth
Tax History
| Year | Tax Paid | Tax Assessment Tax Assessment Total Assessment is a certain percentage of the fair market value that is determined by local assessors to be the total taxable value of land and additions on the property. | Land | Improvement |
|---|---|---|---|---|
| 2024 | $7,420 | $115,500 | $20,400 | $95,100 |
| 2023 | $11,176 | $115,500 | $20,400 | $95,100 |
| 2022 | $10,913 | $115,500 | $20,400 | $95,100 |
| 2021 | $10,790 | $115,500 | $20,400 | $95,100 |
| 2020 | $6,464 | $115,500 | $20,400 | $95,100 |
| 2019 | $3,642 | $115,500 | $20,400 | $95,100 |
| 2018 | $6,286 | $115,500 | $20,400 | $95,100 |
| 2017 | $6,335 | $115,500 | $20,400 | $95,100 |
| 2016 | $6,376 | $115,500 | $20,400 | $95,100 |
| 2015 | $5,666 | $115,500 | $20,400 | $95,100 |
| 2014 | $5,666 | $115,500 | $20,400 | $95,100 |
Source: Public Records
Map
Nearby Homes