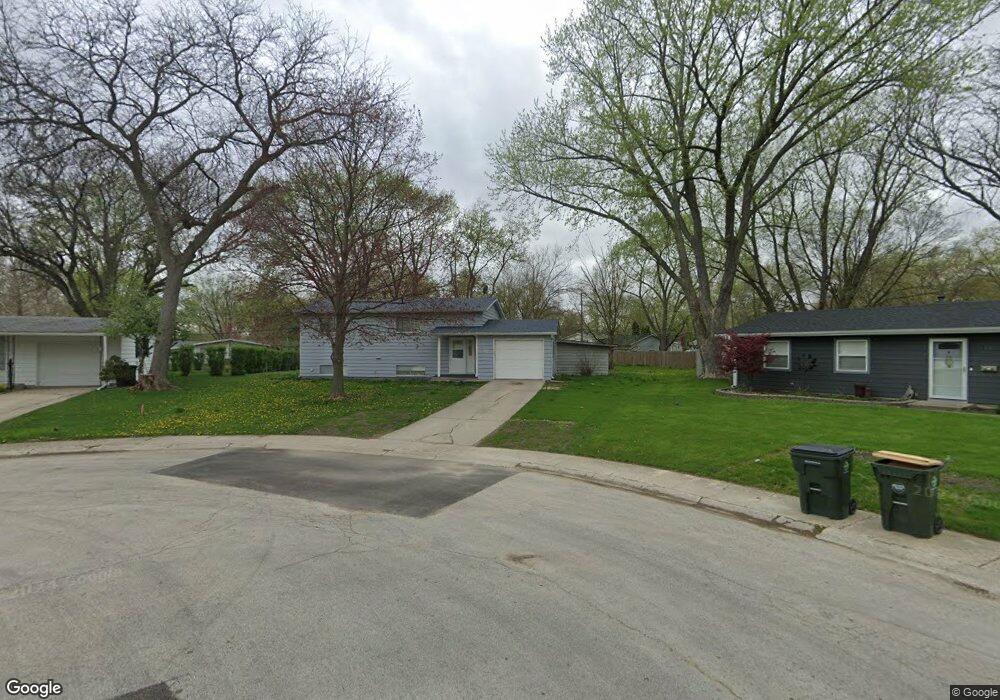
17 Crescent Ct Montgomery, IL 60538
Boulder Hill NeighborhoodEstimated Value: $265,000 - $310,000
4
Beds
2
Baths
864
Sq Ft
$331/Sq Ft
Est. Value
About This Home
This home is located at 17 Crescent Ct, Montgomery, IL 60538 and is currently estimated at $285,820, approximately $330 per square foot. 17 Crescent Ct is a home located in Kendall County with nearby schools including Long Beach Elementary School, Plank Junior High School, and Oswego East High School.
Ownership History
Date
Name
Owned For
Owner Type
Purchase Details
Closed on
Sep 23, 2009
Sold by
Secretary Of Housing & Urban Development
Bought by
Rivera Maria D
Current Estimated Value
Home Financials for this Owner
Home Financials are based on the most recent Mortgage that was taken out on this home.
Original Mortgage
$122,735
Outstanding Balance
$80,105
Interest Rate
5.15%
Mortgage Type
FHA
Estimated Equity
$205,715
Purchase Details
Closed on
Jun 12, 2009
Sold by
Espinoza Miguel
Bought by
The Secretary Of Housing & Urban Develop
Purchase Details
Closed on
Jul 14, 2005
Sold by
Olson Alan Jon and King Gail
Bought by
Ramirez Soledad and Espinoza Miguel
Home Financials for this Owner
Home Financials are based on the most recent Mortgage that was taken out on this home.
Original Mortgage
$180,150
Interest Rate
5.69%
Mortgage Type
FHA
Create a Home Valuation Report for This Property
The Home Valuation Report is an in-depth analysis detailing your home's value as well as a comparison with similar homes in the area
Home Values in the Area
Average Home Value in this Area
Purchase History
| Date | Buyer | Sale Price | Title Company |
|---|---|---|---|
| Rivera Maria D | -- | Ticor Title Insurance Co | |
| The Secretary Of Housing & Urban Develop | -- | Fa | |
| Ramirez Soledad | $183,000 | Chicago Title Insurance Comp |
Source: Public Records
Mortgage History
| Date | Status | Borrower | Loan Amount |
|---|---|---|---|
| Open | Rivera Maria D | $122,735 | |
| Previous Owner | Ramirez Soledad | $180,150 |
Source: Public Records
Tax History Compared to Growth
Tax History
| Year | Tax Paid | Tax Assessment Tax Assessment Total Assessment is a certain percentage of the fair market value that is determined by local assessors to be the total taxable value of land and additions on the property. | Land | Improvement |
|---|---|---|---|---|
| 2024 | $5,790 | $79,146 | $23,072 | $56,074 |
| 2023 | $5,334 | $70,666 | $20,600 | $50,066 |
| 2022 | $5,334 | $66,043 | $19,252 | $46,791 |
| 2021 | $4,975 | $60,039 | $17,502 | $42,537 |
| 2020 | $4,810 | $57,730 | $16,829 | $40,901 |
| 2019 | $4,601 | $54,700 | $16,829 | $37,871 |
| 2018 | $4,181 | $49,913 | $15,356 | $34,557 |
| 2017 | $4,039 | $46,003 | $14,153 | $31,850 |
| 2016 | $3,710 | $42,204 | $12,984 | $29,220 |
| 2015 | $3,557 | $39,078 | $12,022 | $27,056 |
| 2014 | -- | $37,575 | $11,560 | $26,015 |
| 2013 | -- | $39,552 | $12,168 | $27,384 |
Source: Public Records
Map
Nearby Homes
- 15 Crescent Ct
- 54 Sierra Rd
- 19 Wyndham Dr Unit 10
- 4 Crestwood Ct
- 75 Pueblo Rd Unit 18
- 34 Pembrooke Rd
- 29 Briarcliff Rd
- 3 Ridgefield Rd
- 8 Clay Ct
- 106 Braeburn Rd
- 47 Old Post Rd
- 122 Longbeach Rd
- 101 Red Fox Run
- 17 Knollwood Dr Unit 3
- 117 Boulder Hill Pass Unit 117
- 114 Heathgate Rd
- 3 Scarsdale Rd
- 23 Old Post Rd
- 124 Heathgate Rd
- 136 Heathgate Rd
- 21 Longbeach Rd
- 74 Circle Dr E
- 2671 Hampton Rd
- 78 Circle Dr E
- 23 Longbeach Rd
- 21 Long Beach Rd
- 13 Crescent Ct
- 72 Circle Dr E
- 25 Longbeach Rd
- 80 Circle Dr E
- 14 Crescent Ct
- 27 Longbeach Rd
- 10 Crescent Ct
- 12 Crescent Ct Unit 10
- 82 Circle Dr E
- 11 Crescent Ct
- 29 Longbeach Rd
- 6 Crescent Ct
- 79 Circle Dr E
- 77 Circle Dr E