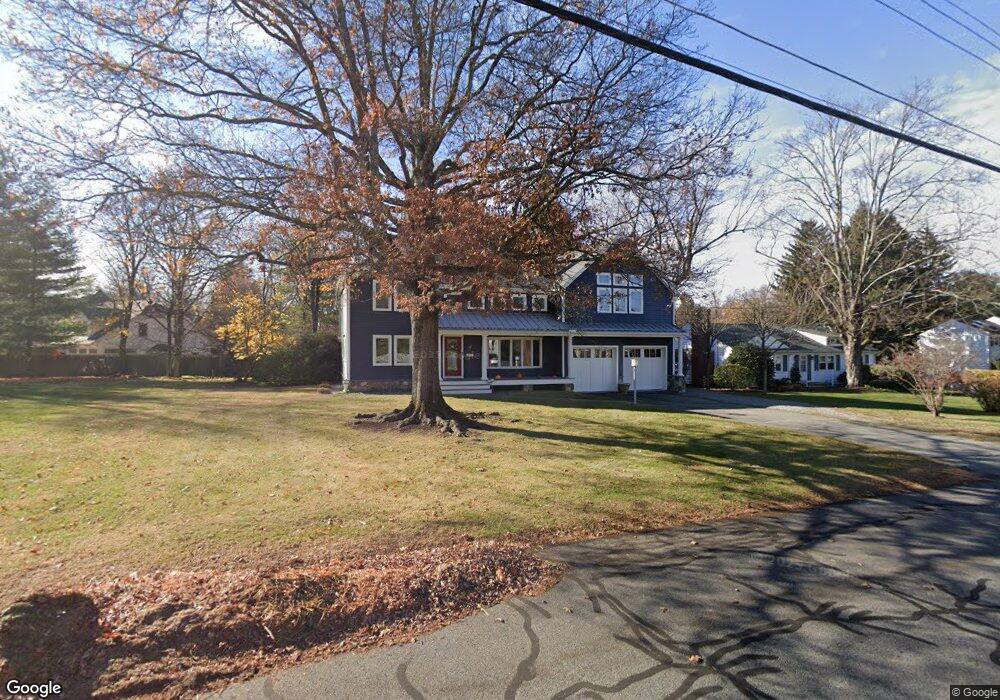
17 Crescent Dr Morristown, NJ 07960
Estimated Value: $1,335,000 - $1,689,000
4
Beds
4
Baths
3,507
Sq Ft
$429/Sq Ft
Est. Value
About This Home
This home is located at 17 Crescent Dr, Morristown, NJ 07960 and is currently estimated at $1,503,684, approximately $428 per square foot. 17 Crescent Dr is a home located in Morris County with nearby schools including Hillcrest School, Thomas Jefferson School, and Alexander Hamilton School.
Ownership History
Date
Name
Owned For
Owner Type
Purchase Details
Closed on
Sep 18, 1998
Sold by
Sterling Jeanine M
Bought by
Servais W Michael and Servais Molly K
Current Estimated Value
Home Financials for this Owner
Home Financials are based on the most recent Mortgage that was taken out on this home.
Original Mortgage
$198,000
Outstanding Balance
$41,199
Interest Rate
6.89%
Estimated Equity
$1,462,485
Purchase Details
Closed on
Aug 8, 1995
Sold by
Schneider William T and Sterling Jeanine M
Bought by
Sterling Jeanine M
Create a Home Valuation Report for This Property
The Home Valuation Report is an in-depth analysis detailing your home's value as well as a comparison with similar homes in the area
Home Values in the Area
Average Home Value in this Area
Purchase History
| Date | Buyer | Sale Price | Title Company |
|---|---|---|---|
| Servais W Michael | $322,500 | -- | |
| Sterling Jeanine M | -- | -- |
Source: Public Records
Mortgage History
| Date | Status | Borrower | Loan Amount |
|---|---|---|---|
| Open | Servais W Michael | $198,000 |
Source: Public Records
Tax History Compared to Growth
Tax History
| Year | Tax Paid | Tax Assessment Tax Assessment Total Assessment is a certain percentage of the fair market value that is determined by local assessors to be the total taxable value of land and additions on the property. | Land | Improvement |
|---|---|---|---|---|
| 2025 | $19,942 | $996,100 | $367,500 | $628,600 |
| 2024 | $19,972 | $996,100 | $367,500 | $628,600 |
| 2023 | $19,972 | $996,100 | $367,500 | $628,600 |
| 2022 | $19,045 | $996,100 | $367,500 | $628,600 |
| 2021 | $19,045 | $996,100 | $367,500 | $628,600 |
| 2020 | $18,547 | $996,100 | $367,500 | $628,600 |
| 2019 | $18,259 | $996,100 | $367,500 | $628,600 |
| 2018 | $18,059 | $996,100 | $367,500 | $628,600 |
| 2017 | $17,940 | $996,100 | $367,500 | $628,600 |
| 2016 | $17,661 | $996,100 | $367,500 | $628,600 |
| 2015 | $13,218 | $521,200 | $242,500 | $278,700 |
| 2014 | $13,046 | $521,200 | $242,500 | $278,700 |
Source: Public Records
Map
Nearby Homes
- 8 West Dr
- 12 Canfield Rd
- 62 Canfield Rd
- 9 Kitchell Rd
- 139 Woodland Ave
- 71 Treadwell Ave
- 9 Beechwood Dr
- 21 Beechwood Dr
- 508 Pitney Place Unit 508
- 523 Pitney Place Unit 523
- 15 Catalpa Rd
- 116 Pitney Place Unit 116
- 63 Village Dr
- 60 Spring Valley Rd
- 320 South St Unit F
- 320 South St Unit E
- 2 Twombly Ct Unit B
- 4 Punch Bowl Rd
- 131 Washington Ave
- 180 Franklin St