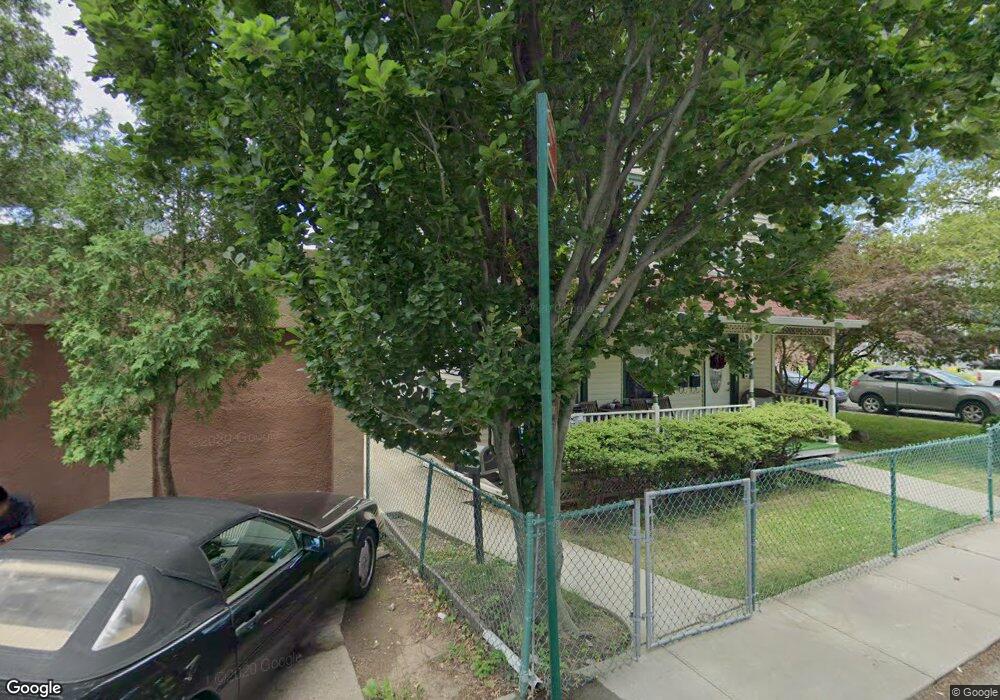
17 Crist St Staten Island, NY 10305
Grasmere NeighborhoodEstimated Value: $823,000 - $1,223,000
4
Beds
2
Baths
2,753
Sq Ft
$366/Sq Ft
Est. Value
About This Home
This home is located at 17 Crist St, Staten Island, NY 10305 and is currently estimated at $1,008,859, approximately $366 per square foot. 17 Crist St is a home located in Richmond County with nearby schools including P.S. 48 - William C. Wilcox, I.S. 49 Berta A Dreyfus, and Curtis High School.
Ownership History
Date
Name
Owned For
Owner Type
Purchase Details
Closed on
Dec 26, 2013
Sold by
Drakakis Anastasios
Bought by
Drakakis Anastasios and Drakakis Sophia
Current Estimated Value
Home Financials for this Owner
Home Financials are based on the most recent Mortgage that was taken out on this home.
Original Mortgage
$345,807
Outstanding Balance
$97,059
Interest Rate
4.29%
Mortgage Type
FHA
Estimated Equity
$911,800
Purchase Details
Closed on
Mar 9, 2000
Sold by
Burns Patrick and Burns Daniel R
Bought by
Drakakis Anastasios
Home Financials for this Owner
Home Financials are based on the most recent Mortgage that was taken out on this home.
Original Mortgage
$228,000
Interest Rate
8.19%
Purchase Details
Closed on
Dec 23, 1995
Sold by
Dennis Virginia M and Hambley Raymond J
Bought by
Burns Daniel R and Burns James H
Create a Home Valuation Report for This Property
The Home Valuation Report is an in-depth analysis detailing your home's value as well as a comparison with similar homes in the area
Home Values in the Area
Average Home Value in this Area
Purchase History
| Date | Buyer | Sale Price | Title Company |
|---|---|---|---|
| Drakakis Anastasios | -- | The Judicial Title Insurance | |
| Drakakis Anastasios | $240,000 | -- | |
| Burns Daniel R | $80,000 | -- |
Source: Public Records
Mortgage History
| Date | Status | Borrower | Loan Amount |
|---|---|---|---|
| Open | Drakakis Anastasios | $345,807 | |
| Previous Owner | Drakakis Anastasios | $228,000 |
Source: Public Records
Tax History Compared to Growth
Tax History
| Year | Tax Paid | Tax Assessment Tax Assessment Total Assessment is a certain percentage of the fair market value that is determined by local assessors to be the total taxable value of land and additions on the property. | Land | Improvement |
|---|---|---|---|---|
| 2025 | $7,537 | $57,300 | $8,347 | $48,953 |
| 2024 | $7,537 | $54,540 | $8,463 | $46,077 |
| 2023 | $7,358 | $36,232 | $8,769 | $27,463 |
| 2022 | $6,854 | $43,140 | $12,300 | $30,840 |
| 2021 | $7,078 | $45,480 | $12,300 | $33,180 |
| 2020 | $6,859 | $49,560 | $12,300 | $37,260 |
| 2019 | $6,541 | $45,420 | $12,300 | $33,120 |
| 2018 | $6,155 | $30,193 | $7,925 | $22,268 |
| 2017 | $5,832 | $28,609 | $8,089 | $20,520 |
| 2016 | $5,603 | $28,027 | $8,949 | $19,078 |
| 2015 | $5,001 | $27,003 | $8,365 | $18,638 |
| 2014 | $5,001 | $26,059 | $9,687 | $16,372 |
Source: Public Records
Map
Nearby Homes
- 4 Sheridan Ave
- 84 Sheridan Ave
- 98 N Railroad Ave
- 23 Marie St
- 25 Marie St
- 80 Hillcrest Terrace
- 31 Alan Loop Unit 65
- 164 Stonegate Dr
- 63 Gateway Dr Unit 172
- 72 Alan Loop
- 69 Fayette Ave
- 190A Pierce St
- 1 Neckar Ave
- 215 Pierce St
- 190 Pierce St Unit A
- 448 Neckar Ave
- 1890 Clove Rd
- 39 Winfield Ave
- 112 Windermere Rd
- 174 Pierce St
- 78 Sheridan Ave
- 2110E Clove Rd
- 2112 Clove Rd
- 2110 Clove Rd Unit A2
- 2110 Clove Rd
- 2110 Clove Rd Unit A
- 2110 Clove Rd Unit D
- 2110 Clove Rd Unit C
- 2110B Clove Rd
- 2110A Clove Rd
- 2114 Clove Rd
- 65 Grasmere Ave
- 80 Sheridan Ave
- 2104 Clove Rd
- 0 Sheridan Ave
- 73 Grasmere Ave
- 2096 Clove Rd
- 2118 Clove Rd
- 2100 Clove Rd
- 77 Grasmere Ave