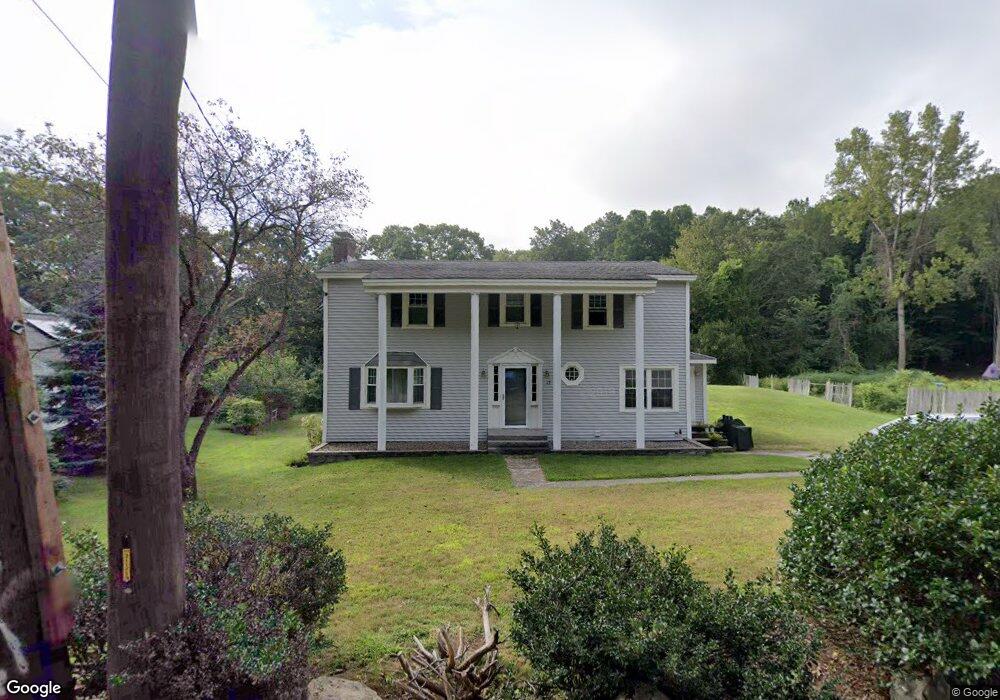
17 Crossman Rd Woburn, MA 01801
Shakerhill NeighborhoodEstimated Value: $866,688 - $1,401,000
4
Beds
2
Baths
2,400
Sq Ft
$438/Sq Ft
Est. Value
About This Home
This home is located at 17 Crossman Rd, Woburn, MA 01801 and is currently estimated at $1,050,422, approximately $437 per square foot. 17 Crossman Rd is a home located in Middlesex County with nearby schools including Reeves Elementary School, Daniel L. Joyce Middle School, and Woburn High School.
Ownership History
Date
Name
Owned For
Owner Type
Purchase Details
Closed on
Apr 29, 2008
Sold by
Greene Ethan Bryant
Bought by
Cooley Cecilia J and Cooley Joseph A
Current Estimated Value
Home Financials for this Owner
Home Financials are based on the most recent Mortgage that was taken out on this home.
Original Mortgage
$403,750
Interest Rate
6.22%
Mortgage Type
Purchase Money Mortgage
Purchase Details
Closed on
Jul 16, 2004
Sold by
Greene Ethan and Greene Shirley
Bought by
Greene Ethan and Greene Shirley
Purchase Details
Closed on
Jul 2, 1992
Sold by
Somrock Corp
Bought by
Murphy Shirley and Greene Ethan
Purchase Details
Closed on
Apr 1, 1992
Sold by
Cialdea Frederick C
Bought by
Somrock Corp
Purchase Details
Closed on
Oct 17, 1990
Sold by
Cialdea Frederick C
Bought by
Cialdea Irene E
Create a Home Valuation Report for This Property
The Home Valuation Report is an in-depth analysis detailing your home's value as well as a comparison with similar homes in the area
Home Values in the Area
Average Home Value in this Area
Purchase History
| Date | Buyer | Sale Price | Title Company |
|---|---|---|---|
| Cooley Cecilia J | $425,000 | -- | |
| Greene Ethan | -- | -- | |
| Greene Ethan | -- | -- | |
| Cooley Cecilia J | $425,000 | -- | |
| Greene Ethan | -- | -- | |
| Murphy Shirley | $147,500 | -- | |
| Somrock Corp | $160,000 | -- | |
| Cialdea Irene E | $174,000 | -- |
Source: Public Records
Mortgage History
| Date | Status | Borrower | Loan Amount |
|---|---|---|---|
| Open | Cialdea Irene E | $405,000 | |
| Closed | Cooley Cecilia J | $403,750 |
Source: Public Records
Tax History Compared to Growth
Tax History
| Year | Tax Paid | Tax Assessment Tax Assessment Total Assessment is a certain percentage of the fair market value that is determined by local assessors to be the total taxable value of land and additions on the property. | Land | Improvement |
|---|---|---|---|---|
| 2025 | $6,365 | $745,300 | $335,100 | $410,200 |
| 2024 | $5,719 | $709,500 | $319,100 | $390,400 |
| 2023 | $5,578 | $641,100 | $290,200 | $350,900 |
| 2022 | $5,434 | $581,800 | $252,400 | $329,400 |
| 2021 | $5,212 | $558,600 | $240,400 | $318,200 |
| 2020 | $5,060 | $542,900 | $240,400 | $302,500 |
| 2019 | $4,891 | $514,800 | $229,000 | $285,800 |
| 2018 | $4,760 | $481,300 | $210,100 | $271,200 |
| 2017 | $4,427 | $445,400 | $200,200 | $245,200 |
| 2016 | $4,232 | $421,100 | $187,100 | $234,000 |
Source: Public Records
Map
Nearby Homes
- 273 Cambridge Rd Unit 202
- 7 Wainwright Rd Unit 118
- 269 Cambridge Rd Unit 203
- 20 Amberwood Dr
- 9 Pond Terrace
- 7 Thornberry Rd
- 41 Squire Rd
- 212 Cambridge Rd
- 5 Azalea Rd
- 26 Berkshire Dr
- 19 Cox Rd
- 19 Gershon Way Unit 1
- 19 Gershon Way
- 189 High St
- 89 Wildwood St
- 14 Nassau Dr
- 192 Lexington St
- 139 High St
- 185 Lexington St
- 21 Derby Dr Unit 21
- 15 Crossman Rd
- 19 Crossman Rd
- 13 Crossman Rd
- 13 Crossman Rd
- 13 Crossman Rd Unit 1
- 6 Crossman Rd
- 21 Crossman Rd
- 11 Crossman Rd
- 46 Amberwood Dr
- 1 Crossman Rd
- 9 Crossman Rd
- 11 Ridgewood Ln
- 48 Amberwood Dr
- 42 Amberwood Dr
- 10 Ridgewood Ln
- 7 Loves Ln Unit C
- 7 Loves Ln Unit B
- 7c Loves Ln
- 9 Ridgewood Ln
- 11 Loves Ln