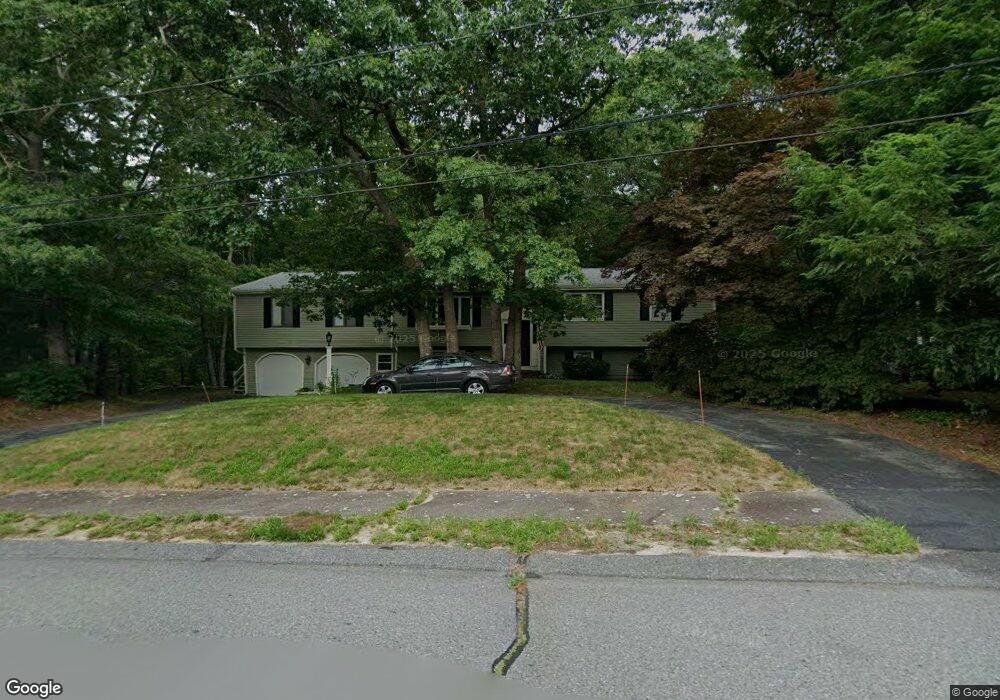
17 Cypress Rd Pembroke, MA 02359
Estimated Value: $695,909 - $818,000
4
Beds
3
Baths
1,903
Sq Ft
$390/Sq Ft
Est. Value
About This Home
This home is located at 17 Cypress Rd, Pembroke, MA 02359 and is currently estimated at $742,477, approximately $390 per square foot. 17 Cypress Rd is a home located in Plymouth County with nearby schools including Pembroke High School.
Ownership History
Date
Name
Owned For
Owner Type
Purchase Details
Closed on
Jan 28, 2013
Sold by
Mcgarry William C and Mcgarry Gladys H
Bought by
Mcgarry Ft and Mcgarry William C
Current Estimated Value
Home Financials for this Owner
Home Financials are based on the most recent Mortgage that was taken out on this home.
Original Mortgage
$130,000
Outstanding Balance
$89,059
Interest Rate
3.36%
Mortgage Type
New Conventional
Estimated Equity
$653,418
Purchase Details
Closed on
Jan 14, 2013
Sold by
Mcgarry Ft and Mcgarry William C
Bought by
Mcgarry William C and Mcgarry Gladys H
Home Financials for this Owner
Home Financials are based on the most recent Mortgage that was taken out on this home.
Original Mortgage
$130,000
Outstanding Balance
$89,059
Interest Rate
3.36%
Mortgage Type
New Conventional
Estimated Equity
$653,418
Purchase Details
Closed on
Mar 5, 2010
Sold by
Mcgarry William C and Mcgarry Gladys H
Bought by
Mcgarry Ft and Mcgarry Gladys H
Purchase Details
Closed on
Sep 8, 1969
Bought by
Mcgarry Ft
Create a Home Valuation Report for This Property
The Home Valuation Report is an in-depth analysis detailing your home's value as well as a comparison with similar homes in the area
Purchase History
| Date | Buyer | Sale Price | Title Company |
|---|---|---|---|
| Mcgarry Ft | -- | -- | |
| Mcgarry William C | -- | -- | |
| Mcgarry Ft | -- | -- | |
| Mcgarry Ft | $5,500 | -- |
Source: Public Records
Mortgage History
| Date | Status | Borrower | Loan Amount |
|---|---|---|---|
| Open | Mcgarry Ft | $130,000 | |
| Previous Owner | Mcgarry Ft | $66,000 | |
| Previous Owner | Mcgarry Ft | $23,000 |
Source: Public Records
Tax History
| Year | Tax Paid | Tax Assessment Tax Assessment Total Assessment is a certain percentage of the fair market value that is determined by local assessors to be the total taxable value of land and additions on the property. | Land | Improvement |
|---|---|---|---|---|
| 2025 | $6,806 | $566,200 | $306,000 | $260,200 |
| 2024 | $6,702 | $557,100 | $300,800 | $256,300 |
| 2023 | $6,668 | $524,200 | $286,000 | $238,200 |
| 2022 | $6,085 | $430,000 | $235,800 | $194,200 |
| 2021 | $5,908 | $405,200 | $220,600 | $184,600 |
| 2020 | $5,819 | $401,600 | $215,800 | $185,800 |
| 2019 | $5,749 | $393,800 | $210,600 | $183,200 |
| 2018 | $5,669 | $380,700 | $210,600 | $170,100 |
| 2017 | $5,546 | $367,300 | $195,800 | $171,500 |
| 2016 | $5,397 | $353,700 | $180,600 | $173,100 |
| 2015 | $5,000 | $339,200 | $170,600 | $168,600 |
Source: Public Records
Map
Nearby Homes
- 100 Valley St
- 246 High St
- 26 Jessica Cir
- 72 Old Cart Path Ln Unit Lot 2
- 77 Old Cart Path Ln Unit Lot 4
- 78 Old Cart Path Ln Unit Lot 3
- 99 Old Washington St
- 14 Baltzer Dr
- 148 High St
- 25 Little Brook Rd
- 32 Little Brook Rd
- 12 Herring Brook Ln
- 171 Pine St
- 25 Carriage Ln Unit 25
- 346 Summer St
- 10 Fir Rd
- 593 Washington St Unit A
- 290 School St
- 7 Andrew Dr
- 131 Elmer St
Your Personal Tour Guide
Ask me questions while you tour the home.