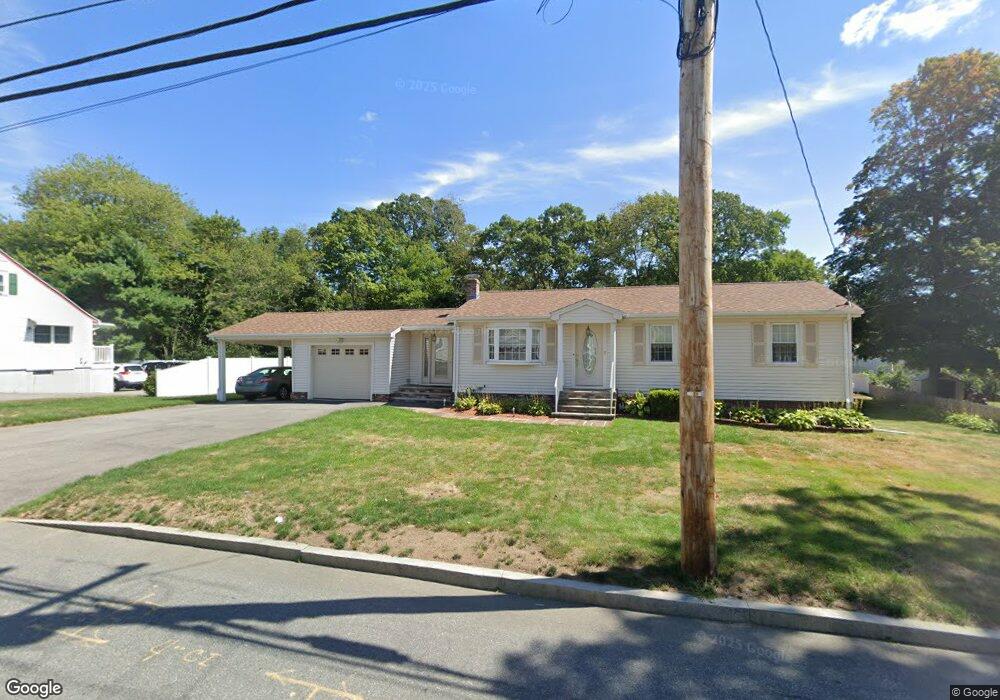
17 Danforth St Taunton, MA 02780
Whittenton Junction NeighborhoodEstimated Value: $448,755 - $500,000
3
Beds
1
Bath
1,050
Sq Ft
$449/Sq Ft
Est. Value
About This Home
This home is located at 17 Danforth St, Taunton, MA 02780 and is currently estimated at $471,689, approximately $449 per square foot. 17 Danforth St is a home located in Bristol County with nearby schools including H. H. Galligan School, Benjamin Friedman Middle School, and Taunton High School.
Ownership History
Date
Name
Owned For
Owner Type
Purchase Details
Closed on
Dec 4, 1997
Sold by
Rose Anthony G and Rose Judith A
Bought by
Roque Rui M and Roque Maria D
Current Estimated Value
Home Financials for this Owner
Home Financials are based on the most recent Mortgage that was taken out on this home.
Original Mortgage
$110,000
Outstanding Balance
$18,692
Interest Rate
7.28%
Mortgage Type
Purchase Money Mortgage
Estimated Equity
$452,997
Create a Home Valuation Report for This Property
The Home Valuation Report is an in-depth analysis detailing your home's value as well as a comparison with similar homes in the area
Home Values in the Area
Average Home Value in this Area
Purchase History
| Date | Buyer | Sale Price | Title Company |
|---|---|---|---|
| Roque Rui M | $132,000 | -- |
Source: Public Records
Mortgage History
| Date | Status | Borrower | Loan Amount |
|---|---|---|---|
| Open | Roque Rui M | $110,000 |
Source: Public Records
Tax History
| Year | Tax Paid | Tax Assessment Tax Assessment Total Assessment is a certain percentage of the fair market value that is determined by local assessors to be the total taxable value of land and additions on the property. | Land | Improvement |
|---|---|---|---|---|
| 2025 | $4,501 | $411,400 | $123,300 | $288,100 |
| 2024 | $4,196 | $375,000 | $123,300 | $251,700 |
| 2023 | $4,103 | $340,500 | $123,300 | $217,200 |
| 2022 | $3,913 | $296,900 | $102,700 | $194,200 |
| 2021 | $3,710 | $261,300 | $93,400 | $167,900 |
| 2020 | $3,688 | $248,200 | $93,400 | $154,800 |
| 2019 | $3,812 | $241,900 | $93,400 | $148,500 |
| 2018 | $3,537 | $225,000 | $94,300 | $130,700 |
| 2017 | $3,406 | $216,800 | $89,400 | $127,400 |
| 2016 | $3,283 | $209,400 | $86,800 | $122,600 |
| 2015 | $3,149 | $209,800 | $85,900 | $123,900 |
| 2014 | $3,017 | $206,500 | $85,900 | $120,600 |
Source: Public Records
Map
Nearby Homes
Your Personal Tour Guide
Ask me questions while you tour the home.