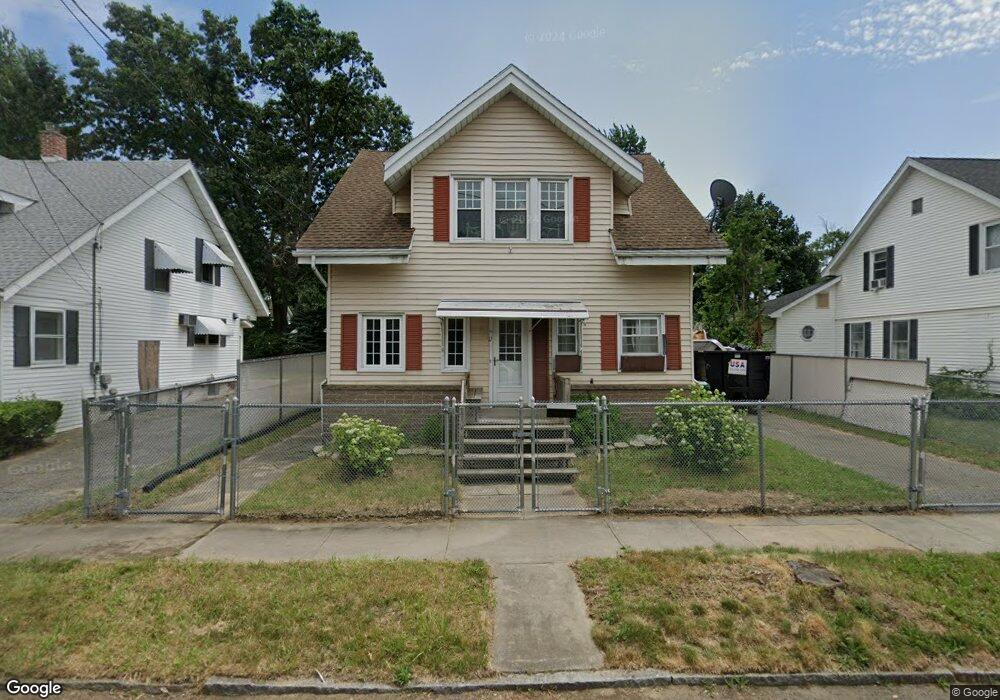
17 Davenport St Chicopee, MA 01013
Chicopee Center NeighborhoodEstimated Value: $258,000 - $300,000
3
Beds
1
Bath
1,222
Sq Ft
$228/Sq Ft
Est. Value
About This Home
This home is located at 17 Davenport St, Chicopee, MA 01013 and is currently estimated at $278,704, approximately $228 per square foot. 17 Davenport St is a home located in Hampden County with nearby schools including Bowe Elementary School, Fairview Middle School, and Chicopee High School.
Ownership History
Date
Name
Owned For
Owner Type
Purchase Details
Closed on
Jan 9, 2006
Sold by
Ribeiro Arthur J and Ribeiro Kathleen A
Bought by
Holmes Kimberly A
Current Estimated Value
Home Financials for this Owner
Home Financials are based on the most recent Mortgage that was taken out on this home.
Original Mortgage
$130,000
Outstanding Balance
$73,113
Interest Rate
6.28%
Mortgage Type
Purchase Money Mortgage
Estimated Equity
$205,591
Create a Home Valuation Report for This Property
The Home Valuation Report is an in-depth analysis detailing your home's value as well as a comparison with similar homes in the area
Home Values in the Area
Average Home Value in this Area
Purchase History
| Date | Buyer | Sale Price | Title Company |
|---|---|---|---|
| Holmes Kimberly A | $180,500 | -- |
Source: Public Records
Mortgage History
| Date | Status | Borrower | Loan Amount |
|---|---|---|---|
| Open | Holmes Kimberly A | $130,000 |
Source: Public Records
Tax History Compared to Growth
Tax History
| Year | Tax Paid | Tax Assessment Tax Assessment Total Assessment is a certain percentage of the fair market value that is determined by local assessors to be the total taxable value of land and additions on the property. | Land | Improvement |
|---|---|---|---|---|
| 2025 | $3,353 | $221,200 | $76,400 | $144,800 |
| 2024 | $3,181 | $215,500 | $74,900 | $140,600 |
| 2023 | $2,985 | $197,000 | $68,100 | $128,900 |
| 2022 | $2,854 | $168,000 | $59,200 | $108,800 |
| 2021 | $2,694 | $153,000 | $53,800 | $99,200 |
| 2020 | $2,535 | $145,200 | $53,800 | $91,400 |
| 2019 | $2,493 | $138,800 | $53,800 | $85,000 |
| 2018 | $2,419 | $132,100 | $51,300 | $80,800 |
| 2017 | $2,326 | $134,400 | $51,300 | $83,100 |
| 2016 | $2,295 | $135,700 | $51,300 | $84,400 |
| 2015 | $2,270 | $129,400 | $51,300 | $78,100 |
| 2014 | $1,135 | $129,400 | $51,300 | $78,100 |
Source: Public Records
Map
Nearby Homes
- 53 Davenport St
- 95 Weaver Rd
- 14-16 Gold St
- 41 Nevada St
- 29 Fairfield Ave
- 20 Gilbert Ave
- 115 Caseland St
- 30 Beauchamp St
- Lot 1 Marion St
- 248 Hampden St
- 2 Marion St
- 255 Moore St
- 110 Roosevelt Ave
- 163 Saratoga Ave
- 168 Hampden St
- 126 Casino Ave
- 57- 59 Stearns Terrace
- 74 David St
- 156 Knollwood St
- 129 Mooreland St
- 13 Davenport St
- 21 Davenport St
- 27 Davenport St
- 42 Rimmon Ave
- 32 Rimmon Ave
- 30 Rimmon Ave
- 48 Rimmon Ave
- 16 Davenport St
- 615 Springfield St
- 31 Davenport St
- 579 Springfield St
- 30 Rimmon Ave
- 621 Springfield St Unit 2
- 26 Davenport St
- 52 Rimmon Ave
- 26 Rimmon Ave
- 35 Davenport St
- 575 Springfield St
- 575 Springfield St Unit 3
- 575 Springfield St Unit 2