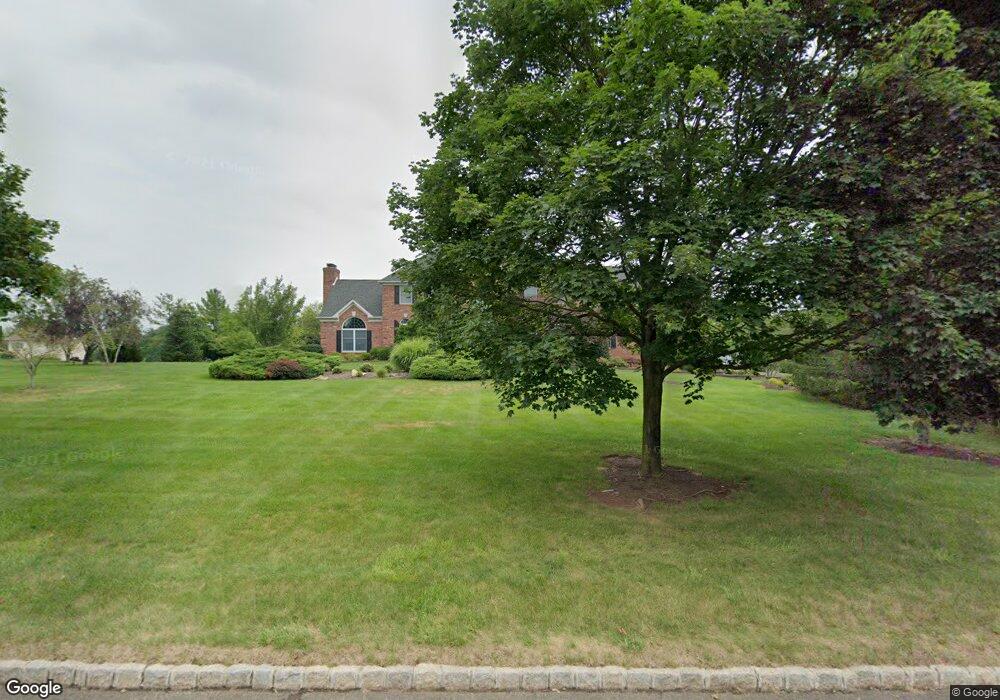
17 Deer Path Hillsborough, NJ 08844
Estimated Value: $1,129,000 - $1,217,000
--
Bed
--
Bath
3,810
Sq Ft
$308/Sq Ft
Est. Value
About This Home
This home is located at 17 Deer Path, Hillsborough, NJ 08844 and is currently estimated at $1,174,892, approximately $308 per square foot. 17 Deer Path is a home located in Somerset County with nearby schools including Hillsborough High School and Cherry Blossom Montessori School.
Ownership History
Date
Name
Owned For
Owner Type
Purchase Details
Closed on
Apr 3, 2006
Sold by
Koval James A
Bought by
Koval James A and Koval Noreen
Current Estimated Value
Home Financials for this Owner
Home Financials are based on the most recent Mortgage that was taken out on this home.
Original Mortgage
$630,000
Outstanding Balance
$359,946
Interest Rate
6.26%
Estimated Equity
$814,946
Purchase Details
Closed on
May 30, 1997
Sold by
Jf Readington Inc
Bought by
Koval James
Home Financials for this Owner
Home Financials are based on the most recent Mortgage that was taken out on this home.
Original Mortgage
$200,000
Interest Rate
7.98%
Create a Home Valuation Report for This Property
The Home Valuation Report is an in-depth analysis detailing your home's value as well as a comparison with similar homes in the area
Home Values in the Area
Average Home Value in this Area
Purchase History
| Date | Buyer | Sale Price | Title Company |
|---|---|---|---|
| Koval James A | -- | -- | |
| Koval James | $375,000 | -- |
Source: Public Records
Mortgage History
| Date | Status | Borrower | Loan Amount |
|---|---|---|---|
| Open | Koval James A | $630,000 | |
| Previous Owner | Koval James | $200,000 |
Source: Public Records
Tax History Compared to Growth
Tax History
| Year | Tax Paid | Tax Assessment Tax Assessment Total Assessment is a certain percentage of the fair market value that is determined by local assessors to be the total taxable value of land and additions on the property. | Land | Improvement |
|---|---|---|---|---|
| 2025 | $20,811 | $1,069,300 | $490,800 | $578,500 |
| 2024 | $20,811 | $971,100 | $435,800 | $535,300 |
| 2023 | $18,989 | $882,000 | $350,800 | $531,200 |
| 2022 | $18,641 | $834,800 | $300,800 | $534,000 |
| 2021 | $18,732 | $797,800 | $260,800 | $537,000 |
| 2020 | $18,345 | $769,500 | $255,800 | $513,700 |
| 2019 | $18,321 | $762,100 | $245,800 | $516,300 |
| 2018 | $18,075 | $747,200 | $240,800 | $506,400 |
| 2017 | $17,601 | $728,800 | $240,800 | $488,000 |
| 2016 | $17,656 | $731,400 | $240,800 | $490,600 |
| 2015 | $17,334 | $727,100 | $230,800 | $496,300 |
| 2014 | $16,546 | $708,900 | $215,800 | $493,100 |
Source: Public Records
Map
Nearby Homes
- 838 Riverside Dr
- 101 Hodge Rd
- 718 Mill Ln
- 53 E Mountain Rd
- 71 Buckland Dr
- 0 Amwell Rd
- 106 Perrine Pike
- 68 Dunedain St
- 126 Carriage Hill Way
- 710 Whitenack Ct
- 104 Devonshire Ct
- 59 Wesley Rd
- 407 Olive St
- 64 Murray Dr
- 42 Bateman Way Unit 9
- 30 Dewitt Ln
- 4 Marshall Rd
- 598 River Rd
- 911 Merritt Dr Unit B2
- 912 Merritt Dr Unit D