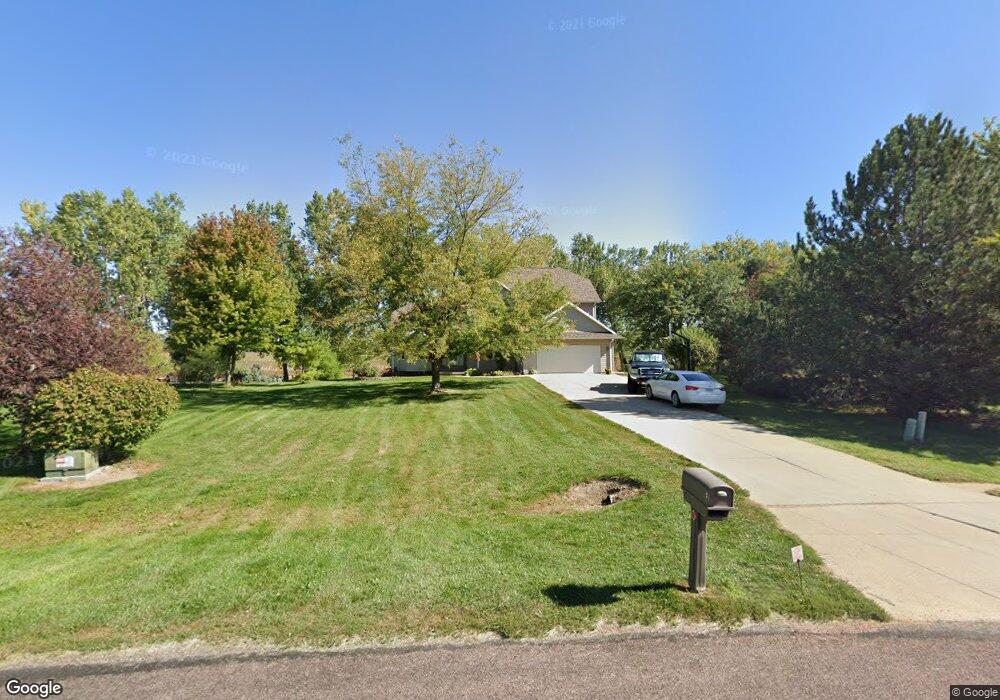
17 Deer Run Cir North Sioux City, SD 57049
Estimated Value: $502,000 - $578,000
3
Beds
--
Bath
2,458
Sq Ft
$220/Sq Ft
Est. Value
About This Home
This home is located at 17 Deer Run Cir, North Sioux City, SD 57049 and is currently estimated at $541,162, approximately $220 per square foot. 17 Deer Run Cir is a home with nearby schools including Dakota Valley Elementary School, Dakota Valley Junior High School, and Dakota Valley High School.
Create a Home Valuation Report for This Property
The Home Valuation Report is an in-depth analysis detailing your home's value as well as a comparison with similar homes in the area
Home Values in the Area
Average Home Value in this Area
Tax History Compared to Growth
Tax History
| Year | Tax Paid | Tax Assessment Tax Assessment Total Assessment is a certain percentage of the fair market value that is determined by local assessors to be the total taxable value of land and additions on the property. | Land | Improvement |
|---|---|---|---|---|
| 2025 | $5,458 | $387,624 | $48,864 | $338,760 |
| 2024 | $5,458 | $390,697 | $51,937 | $338,760 |
| 2023 | $4,746 | $334,237 | $51,937 | $282,300 |
| 2022 | $4,418 | $290,641 | $45,163 | $245,478 |
| 2021 | $4,390 | $290,641 | $45,163 | $245,478 |
| 2020 | $4,166 | $278,952 | $45,163 | $233,789 |
| 2019 | $4,010 | $270,048 | $45,163 | $224,885 |
| 2018 | $3,616 | $270,048 | $45,163 | $224,885 |
| 2017 | $3,560 | $239,492 | $0 | $239,492 |
| 2016 | $3,570 | $239,492 | $0 | $239,492 |
| 2015 | $3,570 | $239,492 | $0 | $239,492 |
| 2014 | $3,642 | $239,492 | $0 | $239,492 |
| 2013 | $3,708 | $239,492 | $0 | $239,492 |
| 2012 | $3,708 | $239,492 | $45,163 | $194,329 |
Source: Public Records
Map
Nearby Homes
- 10 Evergreen Ln
- 159 Suncoast Dr
- 115 Westwood Ln
- 165 Suncoast Dr
- 914 Wynstone Dr
- 920 Wynstone Dr
- 4260 N Highway 105
- 349 Lakeshore Dr
- 946 Wynstone Dr
- 359 Lakeshore Dr
- 369 Lakeshore Dr
- 48220 332nd St
- 2 Union Ct
- 992 Wynstone Dr
- 908 S Turtle Cove
- 1900 Hoffman Rd
- 910 S Turtle Cove
- 1004 Wynstone Dr
- 929 Campbell St
- 1530 S Derby Ln
- 18 Deer Run Cir
- 16 Deer Run Cir
- 32 Deer Run Cir
- 14 Deer Run Cir
- 31 Deer Run Cir
- 20 Deer Run Cir
- 13 Deer Run Cir
- 21 Deer Run Cir
- 30 Deer Run Cir
- 12 Deer Run Cir
- 19 Deer Run Cir
- 22 Deer Run Cir
- 33 Deer Run Cir
- 11 Deer Run Cir
- 34 Deer Run Cir
- 28 Deer Run Cir
- 23 Deer Run Cir
- 1751 Northshore Dr
- 35 Deer Run Cir
- 27 Deer Run Cir