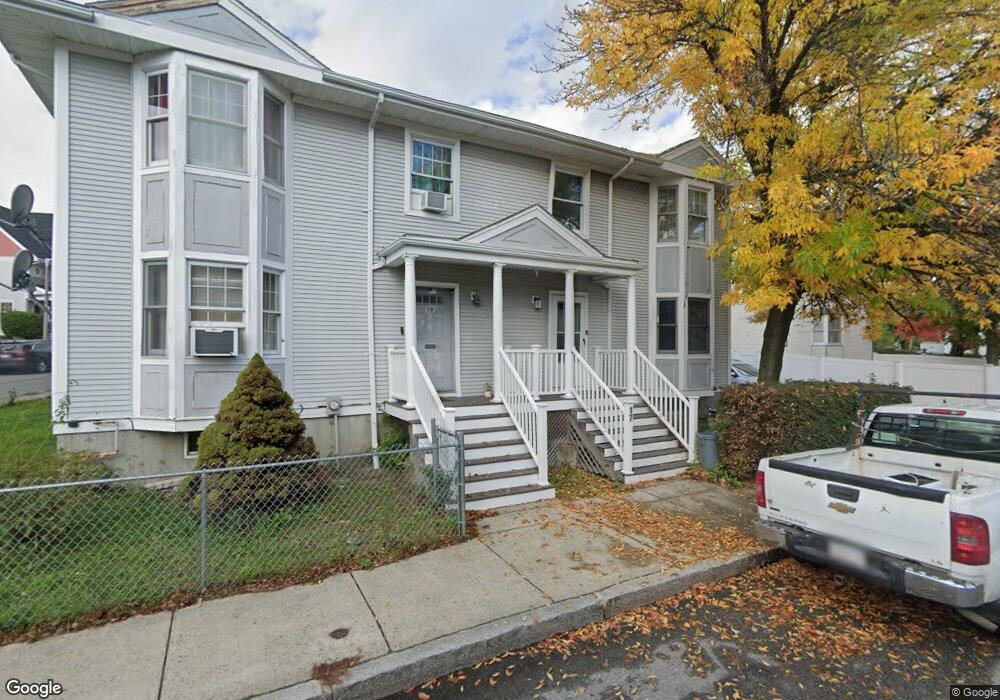
17 Dennis St Roxbury, MA 02119
Dudley-Brunswick King NeighborhoodEstimated Value: $257,000 - $575,000
3
Beds
2
Baths
1,410
Sq Ft
$309/Sq Ft
Est. Value
About This Home
This home is located at 17 Dennis St, Roxbury, MA 02119 and is currently estimated at $435,984, approximately $309 per square foot. 17 Dennis St is a home located in Suffolk County with nearby schools including Dudley Street Neighborhood Charter School and City on a Hill Charter Public School.
Ownership History
Date
Name
Owned For
Owner Type
Purchase Details
Closed on
Aug 12, 2016
Sold by
Dni Winthrop Estates L
Bought by
Holdi Dudley Neighbors
Current Estimated Value
Purchase Details
Closed on
May 10, 2006
Sold by
Badgett Deborah
Bought by
Grossett Carolyn
Home Financials for this Owner
Home Financials are based on the most recent Mortgage that was taken out on this home.
Original Mortgage
$96,086
Interest Rate
6.4%
Mortgage Type
Purchase Money Mortgage
Purchase Details
Closed on
Dec 30, 2005
Sold by
Dudley Neighbors Inc
Bought by
Dni Winthrop Ests Llc
Create a Home Valuation Report for This Property
The Home Valuation Report is an in-depth analysis detailing your home's value as well as a comparison with similar homes in the area
Home Values in the Area
Average Home Value in this Area
Purchase History
| Date | Buyer | Sale Price | Title Company |
|---|---|---|---|
| Holdi Dudley Neighbors | -- | -- | |
| Holdi Dudley Neighbors | -- | -- | |
| Grossett Carolyn | $124,788 | -- | |
| Dni Winthrop Ests Llc | -- | -- |
Source: Public Records
Mortgage History
| Date | Status | Borrower | Loan Amount |
|---|---|---|---|
| Previous Owner | Grossett Carolyn | $96,086 |
Source: Public Records
Tax History Compared to Growth
Tax History
| Year | Tax Paid | Tax Assessment Tax Assessment Total Assessment is a certain percentage of the fair market value that is determined by local assessors to be the total taxable value of land and additions on the property. | Land | Improvement |
|---|---|---|---|---|
| 2025 | $2,243 | $193,700 | $63,921 | $129,779 |
| 2024 | $2,011 | $184,500 | $49,815 | $134,685 |
| 2023 | $1,887 | $175,700 | $47,439 | $128,261 |
| 2022 | $1,820 | $167,300 | $45,171 | $122,129 |
| 2021 | $1,700 | $159,300 | $0 | $159,300 |
| 2020 | $1,602 | $151,681 | $56,700 | $94,981 |
| 2019 | $1,599 | $151,681 | $57,600 | $94,081 |
| 2018 | $1,471 | $140,400 | $57,600 | $82,800 |
| 2017 | $1,430 | $135,000 | $57,600 | $77,400 |
| 2016 | $1,428 | $129,780 | $57,500 | $72,280 |
| 2015 | $1,564 | $129,156 | $74,200 | $54,956 |
| 2014 | $1,617 | $128,532 | $74,200 | $54,332 |
Source: Public Records
Map
Nearby Homes
- 24 Clarence St Unit 24R
- 80 Blue Hill Ave Unit 5
- 108 Mount Pleasant Ave Unit 108R
- 45 Woodville St
- 101 Mount Pleasant Ave
- 79 W Cottage St
- 119 Blue Hill Ave
- 33 Copeland Park Unit C
- 22 Alaska St
- 59 Perrin St
- 59 Perrin St Unit 1
- 7 Langford Park Unit 3
- 31 Alaska St
- 133 Blue Hill Ave
- Lot 84 Blue Hill Ave
- 21 Dean St
- 66 Burrell St
- 69 Burrell St
- 29 E Cottage St
- 30 Copeland St Unit 1