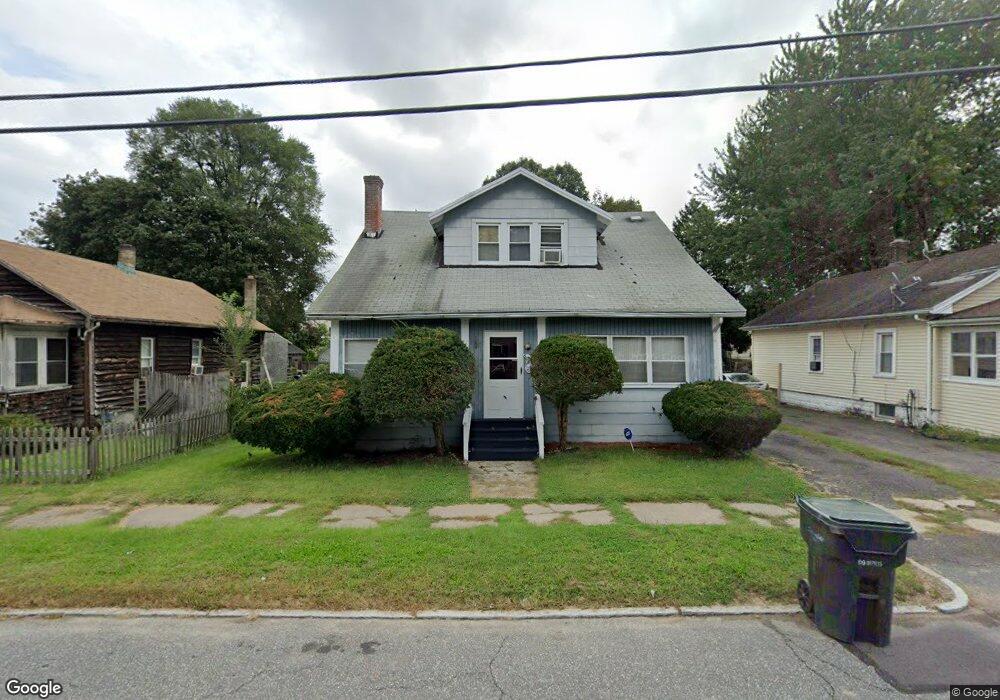
17 Denver St Springfield, MA 01109
Pine Point NeighborhoodEstimated Value: $263,943 - $288,000
4
Beds
1
Bath
1,401
Sq Ft
$195/Sq Ft
Est. Value
About This Home
This home is located at 17 Denver St, Springfield, MA 01109 and is currently estimated at $273,736, approximately $195 per square foot. 17 Denver St is a home located in Hampden County with nearby schools including Thomas M Balliet Elementary School, John J Duggan Middle, and Roger L. Putnam Vocational Technical Academy.
Ownership History
Date
Name
Owned For
Owner Type
Purchase Details
Closed on
May 6, 1997
Sold by
Hatch Dale R and Hatch Karen B
Bought by
Obanner Theresa A
Current Estimated Value
Home Financials for this Owner
Home Financials are based on the most recent Mortgage that was taken out on this home.
Original Mortgage
$2,250
Outstanding Balance
$296
Interest Rate
8.09%
Estimated Equity
$273,440
Create a Home Valuation Report for This Property
The Home Valuation Report is an in-depth analysis detailing your home's value as well as a comparison with similar homes in the area
Home Values in the Area
Average Home Value in this Area
Purchase History
| Date | Buyer | Sale Price | Title Company |
|---|---|---|---|
| Obanner Theresa A | $62,500 | -- |
Source: Public Records
Mortgage History
| Date | Status | Borrower | Loan Amount |
|---|---|---|---|
| Open | Obanner Theresa A | $2,250 | |
| Open | Obanner Theresa A | $61,863 | |
| Previous Owner | Obanner Theresa A | $55,000 |
Source: Public Records
Tax History
| Year | Tax Paid | Tax Assessment Tax Assessment Total Assessment is a certain percentage of the fair market value that is determined by local assessors to be the total taxable value of land and additions on the property. | Land | Improvement |
|---|---|---|---|---|
| 2025 | $3,277 | $209,000 | $40,400 | $168,600 |
| 2024 | $3,336 | $207,700 | $33,600 | $174,100 |
| 2023 | $3,122 | $183,100 | $30,600 | $152,500 |
| 2022 | $2,821 | $149,900 | $28,600 | $121,300 |
| 2021 | $2,580 | $136,500 | $26,000 | $110,500 |
| 2020 | $2,722 | $139,400 | $26,000 | $113,400 |
| 2019 | $2,515 | $127,800 | $26,000 | $101,800 |
| 2018 | $2,200 | $111,800 | $26,000 | $85,800 |
| 2017 | $2,086 | $106,100 | $24,000 | $82,100 |
| 2016 | $1,891 | $96,200 | $24,000 | $72,200 |
| 2015 | $1,981 | $100,700 | $24,000 | $76,700 |
Source: Public Records
Map
Nearby Homes
Your Personal Tour Guide
Ask me questions while you tour the home.