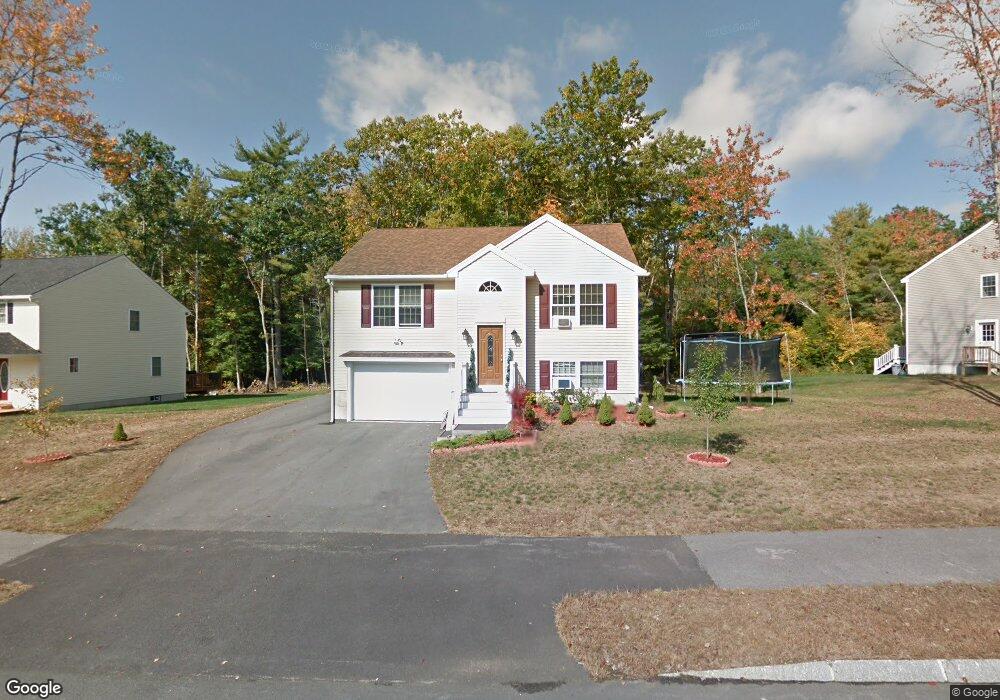
17 Dobson Rd Berwick, ME 03901
Estimated Value: $422,124 - $524,000
3
Beds
3
Baths
1,672
Sq Ft
$276/Sq Ft
Est. Value
About This Home
This home is located at 17 Dobson Rd, Berwick, ME 03901 and is currently estimated at $460,781, approximately $275 per square foot. 17 Dobson Rd is a home located in York County with nearby schools including Noble High School and Tri-City Christian Academy.
Ownership History
Date
Name
Owned For
Owner Type
Purchase Details
Closed on
Oct 10, 2014
Sold by
Vo Yvonne H and Nguyen Vuong S
Bought by
Nguyen Hai and Ho Tuyen K
Current Estimated Value
Home Financials for this Owner
Home Financials are based on the most recent Mortgage that was taken out on this home.
Original Mortgage
$180,000
Outstanding Balance
$137,198
Interest Rate
4.1%
Mortgage Type
Purchase Money Mortgage
Estimated Equity
$323,583
Purchase Details
Closed on
Jun 18, 2013
Sold by
Nguyen Judy
Bought by
Nguyen Vuong S and Vo Yvonne H
Home Financials for this Owner
Home Financials are based on the most recent Mortgage that was taken out on this home.
Original Mortgage
$181,000
Interest Rate
3.39%
Mortgage Type
New Conventional
Create a Home Valuation Report for This Property
The Home Valuation Report is an in-depth analysis detailing your home's value as well as a comparison with similar homes in the area
Home Values in the Area
Average Home Value in this Area
Purchase History
| Date | Buyer | Sale Price | Title Company |
|---|---|---|---|
| Nguyen Hai | $225,000 | -- | |
| Nguyen Hai | $225,000 | -- | |
| Nguyen Hai | $225,000 | -- | |
| Nguyen Vuong S | -- | -- | |
| Nguyen Vuong S | -- | -- |
Source: Public Records
Mortgage History
| Date | Status | Borrower | Loan Amount |
|---|---|---|---|
| Open | Nguyen Hai | $180,000 | |
| Closed | Nguyen Vuong S | $180,000 | |
| Previous Owner | Nguyen Vuong S | $181,000 |
Source: Public Records
Tax History
| Year | Tax Paid | Tax Assessment Tax Assessment Total Assessment is a certain percentage of the fair market value that is determined by local assessors to be the total taxable value of land and additions on the property. | Land | Improvement |
|---|---|---|---|---|
| 2024 | $4,567 | $366,200 | $115,100 | $251,100 |
| 2023 | $4,162 | $227,200 | $82,200 | $145,000 |
| 2022 | $4,140 | $227,200 | $82,200 | $145,000 |
| 2021 | $4,158 | $227,200 | $82,200 | $145,000 |
| 2020 | $4,420 | $228,300 | $82,200 | $146,100 |
| 2019 | $4,002 | $228,300 | $82,200 | $146,100 |
| 2018 | $3,962 | $225,100 | $66,900 | $158,200 |
| 2017 | $3,860 | $225,100 | $66,900 | $158,200 |
| 2016 | $3,669 | $225,100 | $66,900 | $158,200 |
| 2014 | $3,579 | $225,100 | $66,900 | $158,200 |
| 2013 | $3,613 | $225,100 | $66,900 | $158,200 |
Source: Public Records
Map
Nearby Homes