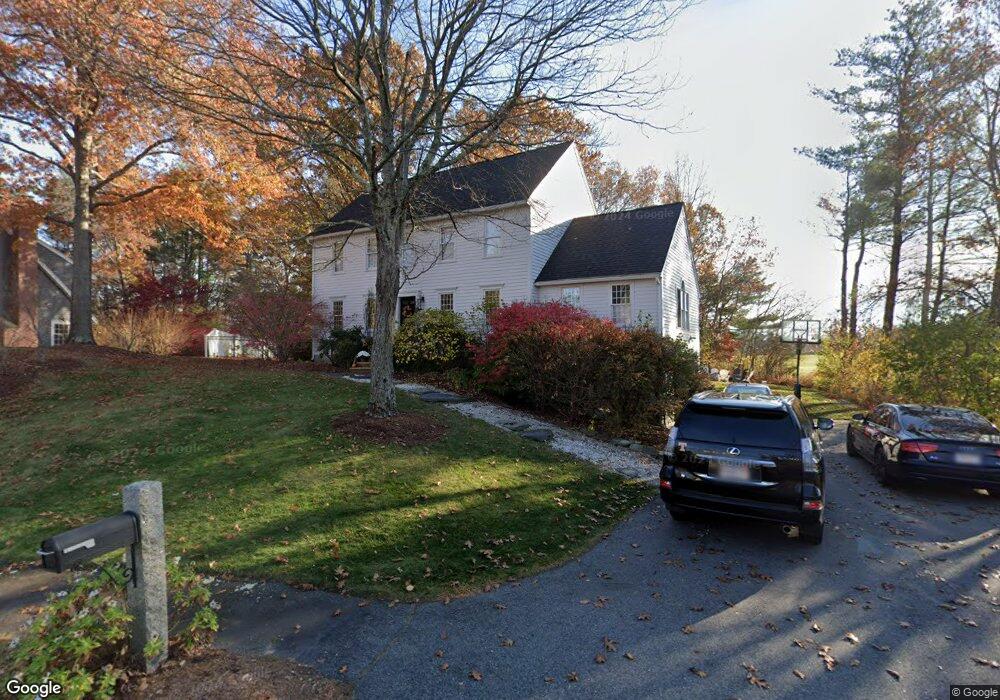
17 Doe Run Dr Newburyport, MA 01950
Estimated Value: $1,169,000 - $1,360,000
4
Beds
3
Baths
2,403
Sq Ft
$515/Sq Ft
Est. Value
About This Home
This home is located at 17 Doe Run Dr, Newburyport, MA 01950 and is currently estimated at $1,236,459, approximately $514 per square foot. 17 Doe Run Dr is a home located in Essex County with nearby schools including Francis T. Bresnahan Elementary School, Edward G. Molin Elementary School, and Rupert A. Nock Middle School.
Ownership History
Date
Name
Owned For
Owner Type
Purchase Details
Closed on
Nov 10, 2014
Sold by
Reska Margraret M and Reska Paul S
Bought by
Duncan Craig and Duncan Kelly
Current Estimated Value
Home Financials for this Owner
Home Financials are based on the most recent Mortgage that was taken out on this home.
Original Mortgage
$465,600
Outstanding Balance
$359,019
Interest Rate
4.18%
Mortgage Type
New Conventional
Estimated Equity
$877,440
Purchase Details
Closed on
Dec 3, 1996
Sold by
Ehrhardt David and Miller Kelly A
Bought by
Reska Paul S and Reska Margaret M
Purchase Details
Closed on
Mar 31, 1994
Sold by
Kelleher Peter E
Bought by
Sg Rt and Hill
Purchase Details
Closed on
Dec 8, 1993
Sold by
Cush Jan C
Bought by
Sg Rt and Hill Edward C
Create a Home Valuation Report for This Property
The Home Valuation Report is an in-depth analysis detailing your home's value as well as a comparison with similar homes in the area
Home Values in the Area
Average Home Value in this Area
Purchase History
| Date | Buyer | Sale Price | Title Company |
|---|---|---|---|
| Duncan Craig | $640,000 | -- | |
| Reska Paul S | $260,000 | -- | |
| Sg Rt | $25,000 | -- | |
| Sg Rt | $15,000 | -- |
Source: Public Records
Mortgage History
| Date | Status | Borrower | Loan Amount |
|---|---|---|---|
| Open | Duncan Craig | $465,600 | |
| Previous Owner | Sg Rt | $100,000 | |
| Previous Owner | Sg Rt | $292,000 | |
| Previous Owner | Sg Rt | $265,000 |
Source: Public Records
Tax History Compared to Growth
Tax History
| Year | Tax Paid | Tax Assessment Tax Assessment Total Assessment is a certain percentage of the fair market value that is determined by local assessors to be the total taxable value of land and additions on the property. | Land | Improvement |
|---|---|---|---|---|
| 2025 | $9,481 | $989,700 | $483,700 | $506,000 |
| 2024 | $9,181 | $920,900 | $440,200 | $480,700 |
| 2023 | $8,296 | $772,400 | $383,000 | $389,400 |
| 2022 | $8,254 | $687,300 | $319,900 | $367,400 |
| 2021 | $8,055 | $637,300 | $291,400 | $345,900 |
| 2020 | $7,980 | $621,500 | $291,400 | $330,100 |
| 2019 | $8,129 | $621,500 | $291,400 | $330,100 |
| 2018 | $7,713 | $581,700 | $277,900 | $303,800 |
| 2017 | $7,718 | $573,800 | $264,700 | $309,100 |
| 2016 | $7,048 | $526,400 | $241,300 | $285,100 |
| 2015 | -- | $526,400 | $241,300 | $285,100 |
Source: Public Records
Map
Nearby Homes
- 6 Doe Run Dr
- 138 Low St
- 2 Hunter Dr
- 14 Norman Ave
- 29 Columbus Ave
- 14 Farrell St
- 42 Myrtle Ave
- 6 Summit Place
- 14 Dexter Ln Unit 1
- 347 High St
- 17 Lavalley Ln
- 6 Woodman Way Unit 402
- 6 Woodman Way Unit 121
- 30 Oakland St Unit 2
- 10 Clipper Way
- 26 Oakland St
- 15 Howard St
- 27 Warren St Unit 1
- 22 Kent St Unit 1
- 45 Boardman St Unit 1